Charting workflows, market-data downloads, indicators, drawing tools, watchlists, workspaces, multi-monitor use, and settings in one offline-friendly HTML guide.
16
Manual Pages
77
Bright Screenshots
77
Dark Screenshots
AptiStockX Workspace
AptiStockX Help Manual
Welcome to the AptiStockX help manual. AptiStockX is a professional desktop stock charting application for Windows, macOS, and Linux. It supports local CSV data, a global market symbol catalog, market-data downloads from multiple providers, technical indicators, custom indicators, drawing studies, intraday charting, watchlists, multiple-monitor workflows, AI Assistant chart reading, and workspace management.
This manual covers everything from first launch to advanced chart analysis. The source is Markdown and is converted into the local HTML help manual used by AptiStockX.
Press F1 in AptiStockX, or choose Help > Open AptiStockX Help Manual, to open this packaged local manual in your browser.
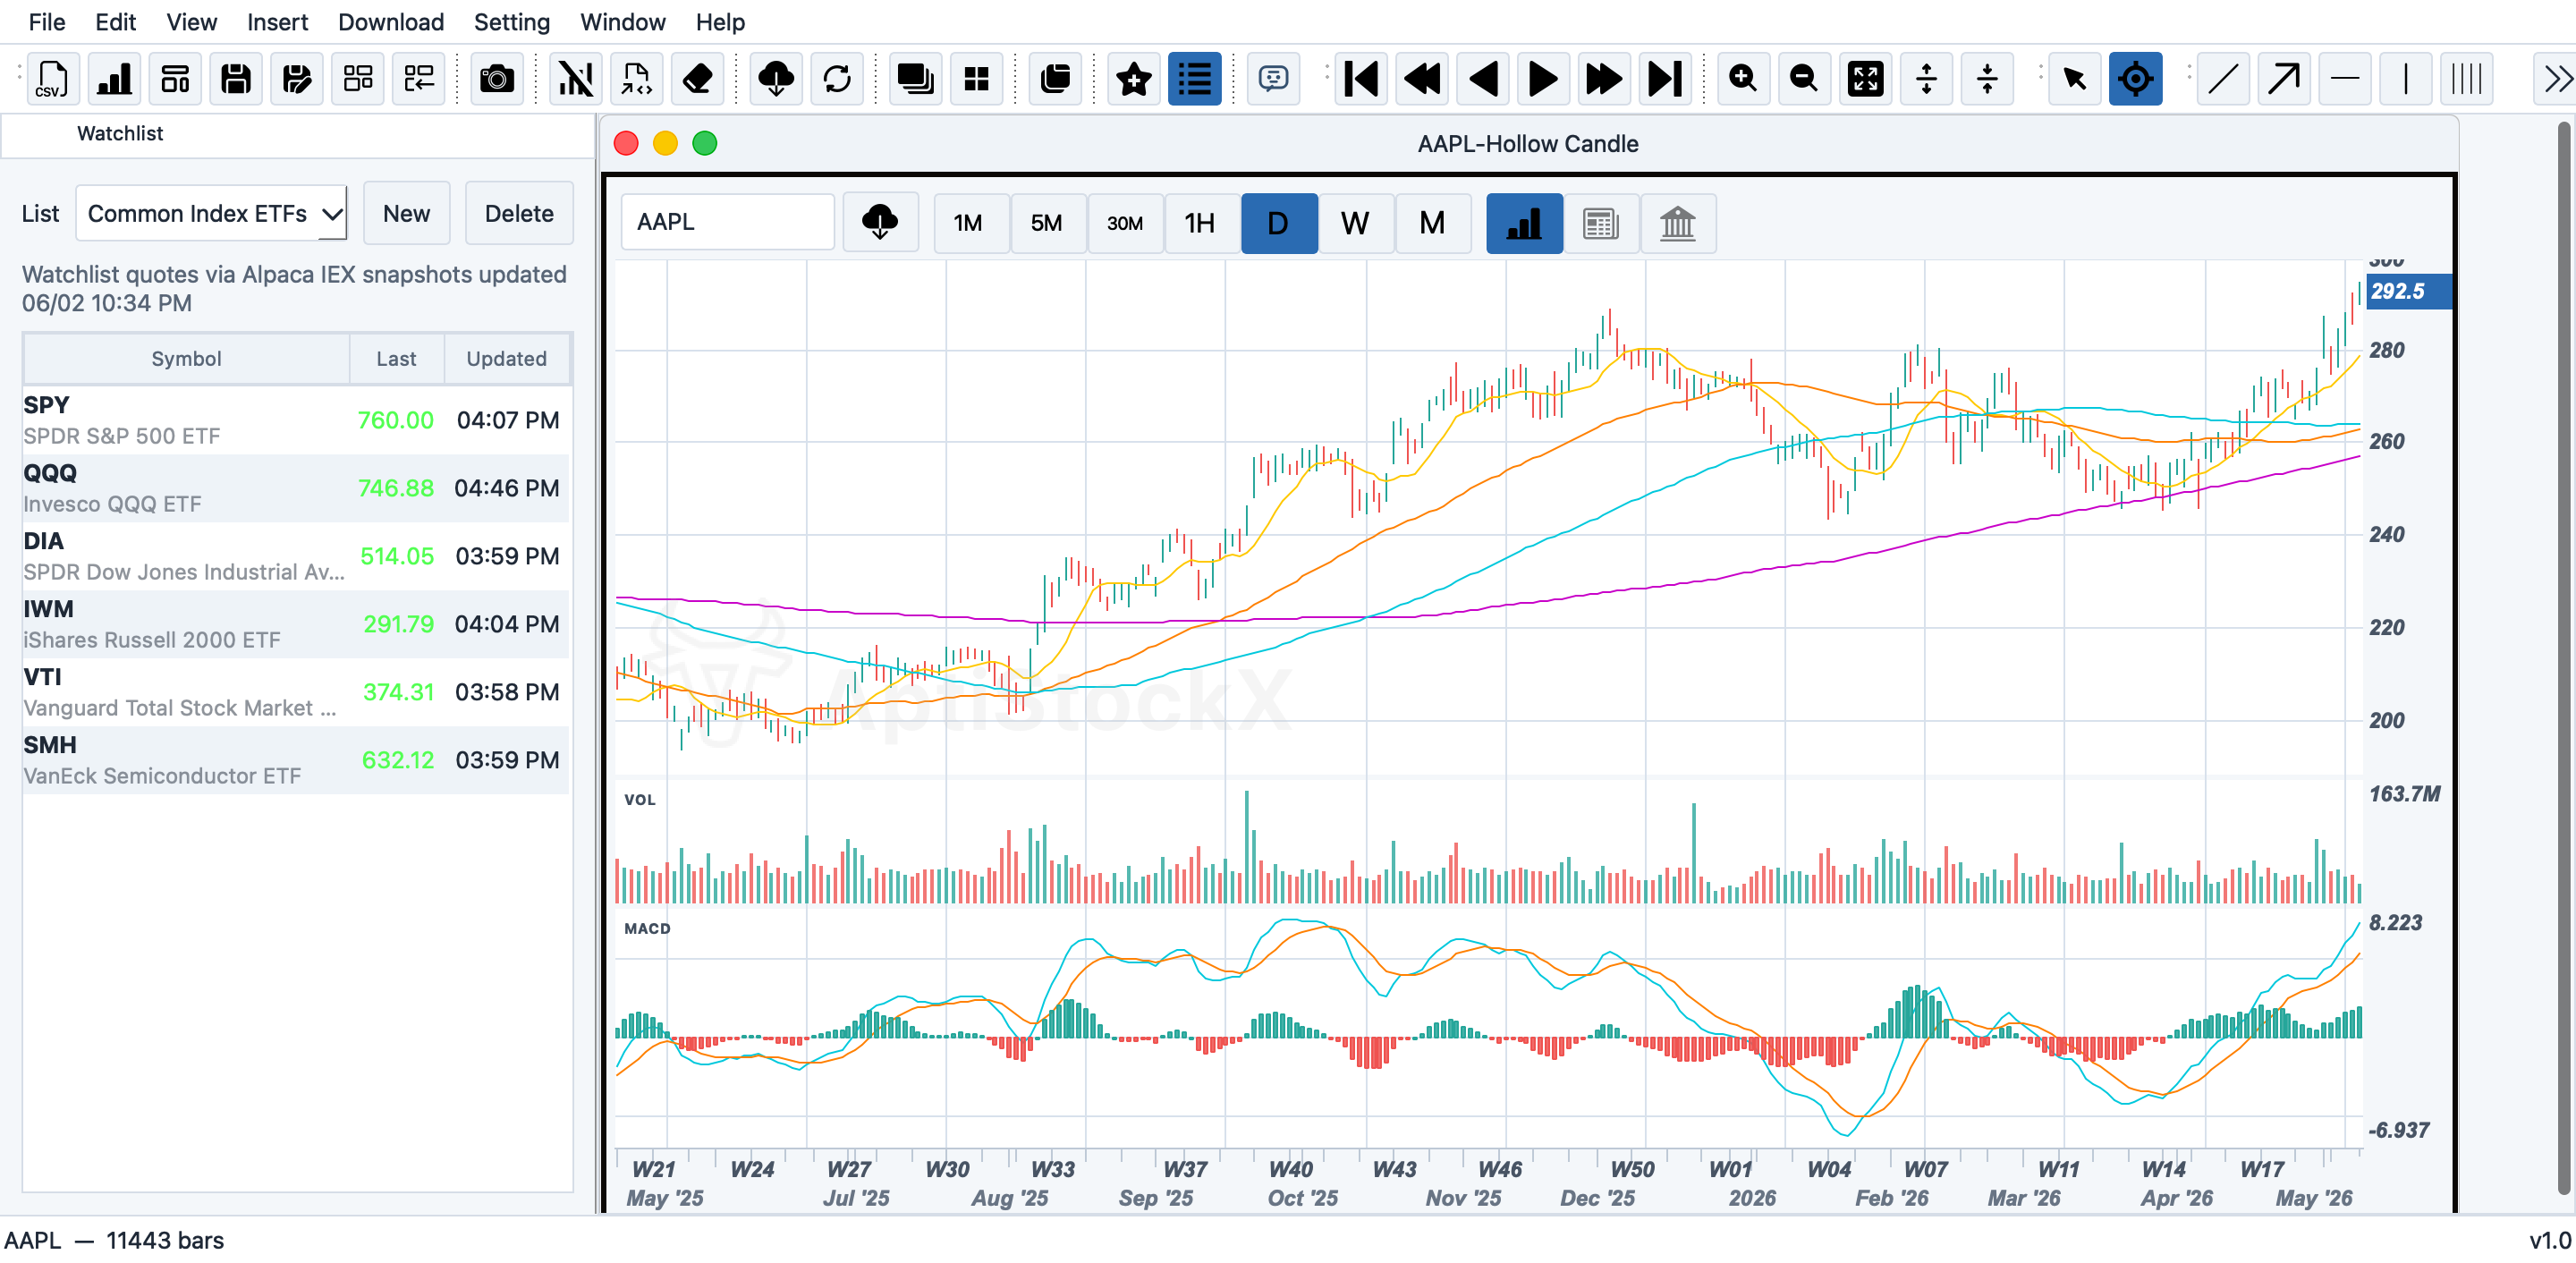
AptiStockX presents a Multiple Document Interface (MDI) workspace. Each open chart lives in its own sub-window inside the MDI area. Sub-windows can be arranged in tabbed mode, cascaded, or tiled from the View and Window menus. Charts can also be duplicated into detached windows for use on a second or third monitor.
Area
Description
Menu bar
File, Edit, View, Insert, Download, Setting, Window, Help
Main toolbar
New chart, Open CSV, Save, Download, Reload, and common commands
Switch between pointer cursor and crosshair cursor
Drawing toolbar
All drawing study tools — lines, Fibonacci, Gann, channels, shapes, and text
MDI area
One or more chart sub-windows displaying price and indicator data
Watchlist dock
Named watchlists with Symbol, Last, and Updated columns
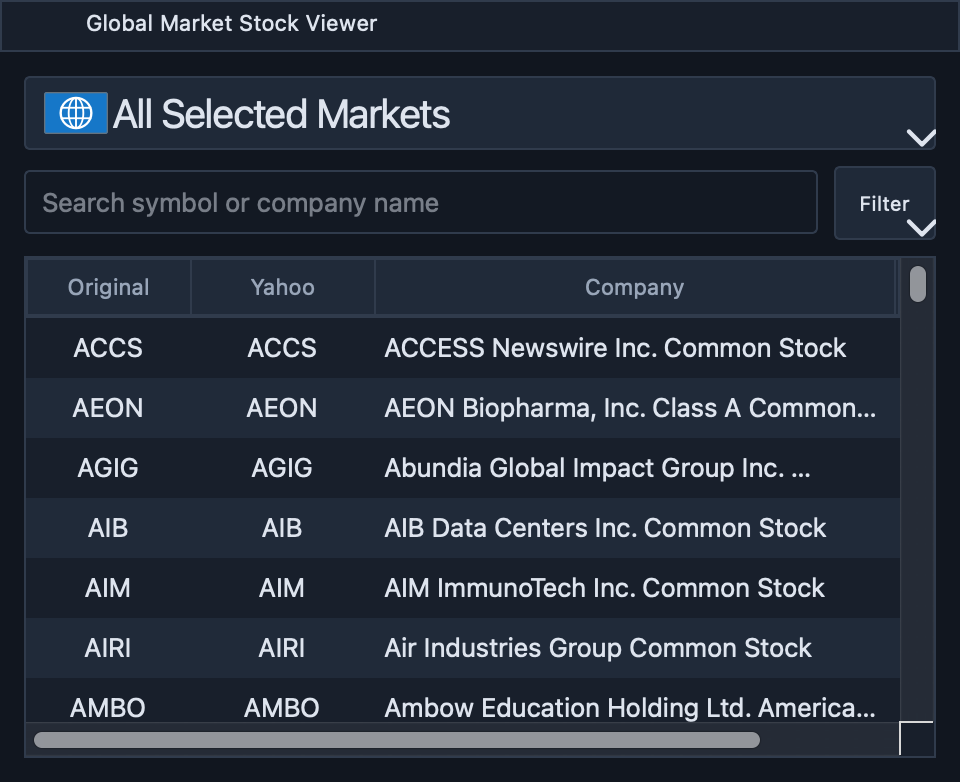
Global Market Stock Viewer
Searchable catalog of exchange-native and Yahoo-compatible symbols by market group
OHLCV data dock
Tabular bar data (Date, Open, High, Low, Close, Volume) for the active chart
Basic Workflow
Most AptiStockX sessions follow this flow:
Open a CSV file (File > Open CSV) or download data for a ticker (Download > Download Data).
Select the chart period using the period buttons at the top of the chart (Daily, Weekly, 1 Hour, etc.).
Use the crosshair, zoom, pan, and Y-axis controls to inspect price action.
Add technical indicators from the Insert menu.
Add drawing studies using the Drawing toolbar.
Save the chart as a .acht file (File > Save Chart) or save a chart/session workspace for later reuse (File > Save Workspace).
Quick Start
This page gives the fastest path to opening data and using the main chart controls in AptiStockX.
Step 1 — Open Data
Option A: Open a CSV File
Choose File > Open CSV (or press Ctrl+O).
Select a stock data CSV file from your computer.
AptiStockX reads the file and opens it as a new chart window.
Option B: Download Data
Choose Download > Download Data.
Enter the ticker symbol (for example: AAPL).
Select the EOD source, intraday source, and the history ranges you want AptiStockX to request.
Click Download. AptiStockX saves the data locally. Open the symbol from the chart symbol input, watchlist, or local CSV after the download completes.
Step 2 — Select a Chart Period
Use the period buttons at the top of the chart window to change the time frame:
Button
Description
1m
1-minute intraday bars
5m
5-minute intraday bars
30m
30-minute intraday bars
1h
1-hour intraday bars
D
Daily bars
W
Weekly bars
M
Monthly bars
The same choices are available from View > Display Period.
Step 3 — Explore the Chart
Crosshair
Switch to crosshair mode using the Cursor Style toolbar or View > Cursor Style > Crosshairs. Moving the mouse over the chart shows:
A horizontal price line and a vertical time line
A price tag on the Y-axis at the cursor position
An OHLCV hover box showing the bar's date, open, high, low, close, and volume
Indicator values for the hovered bar when indicators are active
Zoom and Pan
Mouse wheel — zoom in or out on the chart
Click and drag the chart area to pan left or right
Chart Control toolbar — use the navigation buttons for bar-by-bar or quick navigation
Step 4 — Add an Indicator
Choose an indicator directly from Insert > Main Chart Indicator to add an overlay, such as Simple Moving Average or Bollinger Bands.
Choose an indicator directly from Insert > Sub Chart Indicator to add a separate pane indicator, such as RSI, MACD, or Volume.
Press F2 or choose Insert > Indicator Parameters to adjust indicators already on the chart.
Step 5 — Save Your Work
Command
What it saves
File > Save Chart (Ctrl+S)
Saves the chart, indicators, and studies to a .acht file
File > Save Workspace
Saves the layout of all open chart windows as a reusable workspace
File > Save as Default Workspace
Makes the current layout the default that loads on next launch
Chart Window
The chart window is the main work area in AptiStockX. It displays price bars, volume, technical indicators, drawing studies, a crosshair with hover data, and price/time axis labels. Multiple chart windows can be open simultaneously inside the MDI workspace.
Top Chart Controls
Each chart window has a controls bar across the top containing:
Control
Description
Symbol input
Type a ticker symbol and press Enter or click the Download button to load data
Download button
Starts a data download for the current symbol
Period buttons
Switch between 1m, 5m, 30m, 1h, D, W, M time frames
Chart / News / Financials tabs
Switch the window between the price chart view, news headlines, and fundamentals
Chart Periods
AptiStockX supports these display periods:
Period
Description
1 Minute
Intraday 1-minute bars — requires intraday data
5 Minutes
Intraday 5-minute bars — requires intraday data
30 Minutes
Intraday 30-minute bars — requires intraday data
1 Hour
Intraday 1-hour bars — requires intraday data
Daily
End-of-day bars (default)
Weekly
One bar per calendar week
Monthly
One bar per calendar month
Intraday periods require intraday data from a configured data provider. See Data Download and Reload for provider setup.
Chart Styles
Choose a chart style from Setting > Price Curve Setting, Setting > Option > Chart, or the chart context menu:
Style
Description
Candlestick
Traditional filled candles with open, high, low, close
Hollow Candle
Candles with a hollow body for up bars
Line
Close-price line
OHLC
Open-High-Low-Close bar lines
Heikin-Ashi
Smoothed candles derived from averaged OHLC values
Renko Bricks
Renko bricks that filter out small price moves
Range
Range bars that advance on a minimum price range
Crosshair and Hover Data
Switch to crosshair mode using the Cursor Style toolbar or View > Cursor Style > Crosshairs.
When crosshair mode is active, moving the mouse over the chart shows:
A horizontal price line extending across all panes
A vertical time line
A price tag on the right Y-axis at the cursor position
Use the Chart Control toolbar, keyboard shortcuts, or View > Chart Control menu to navigate the chart.
Action
Toolbar / Keyboard
Move backward one bar
Left Arrow
Move forward one bar
Right Arrow
Quick backward (multiple bars)
Ctrl+Left Arrow
Quick forward (multiple bars)
Ctrl+Right Arrow
Jump to beginning
Home
Jump to end
End
Broaden candle line
Plus key or Chart Control menu
Narrow candle line
Minus key or Chart Control menu
Zoom in
Ctrl+Minus from the View menu
Zoom out
Ctrl+Plus from the View menu
Reset zoom
Zoom Reset command
Expand Y-axis
Y-axis expand toolbar button
Shrink Y-axis
Y-axis shrink toolbar button
Main Toolbar
The main toolbar provides quick access to the most common file and chart commands.
OHLCV Data Dock
The OHLCV data dock shows the raw bar data for the active chart in a scrollable table. It is useful for reviewing exact price and volume values for any date.
View Menu
The View menu provides access to appearance, cursor style, display period, chart control, and Y-axis settings.
Y-Axis Scale Settings
Use View > Y-Axis Scale Setting to switch between Linear Scale and Log Scale. Use View > Y-Axis Setting to set the active chart's Y-axis scale and vertical zoom factor.
Appearance
Use View > Appearance to switch between Bright and Dark themes. The chart colors, background, and grid adapt to the selected theme.
Data Download and Reload
AptiStockX can download stock data from multiple configured providers and store it locally for charting. Once downloaded, data is available offline and can be reloaded without a network connection.
Download Menu
Download Data
Use Download > Download Data to open the Download Stock Data dialog.
Steps:
Enter one ticker symbol, or enter multiple symbols separated by spaces or commas. When one symbol is entered, AptiStockX looks up the company name and shows it to the right of the symbol field.
Choose the EOD source for end-of-day data.
Choose the Intraday source for 1-minute intraday data.
Choose the EOD range: 1 year, 5 years, 10 years, or Maximum.
Choose the Intraday range: 5 days, 10 days, or Max. The maximum intraday request is limited by the selected provider.
Click Download to begin. Use Cancel to stop an active request or Close to leave the dialog. The progress bar, status line, and results log show download status.
The EOD and intraday sources selected in this dialog control only the current download. They do not change the active chart providers configured in Setting > Data Provider Setting. Downloading from a different provider therefore does not automatically make that provider active for charts.
Downloaded data is saved to the local data folder. Subsequent downloads for the same symbol update the existing file.
When a symbol is typed directly into a chart and no local chart/data file is found, AptiStockX automatically downloads at least five years of EOD history before loading the chart. If the requested period is intraday and intraday charts are available, AptiStockX requests at least the latest five days of intraday data.
The download button beside the chart ticker field follows the active chart period. Daily, weekly, and monthly charts request maximum EOD history. Intraday charts request the maximum intraday range for the configured intraday provider, merge it into the local intraday CSV, and keep the chart on the current intraday period after loading.
Renew Data
Use Download > Renew Data (or press F4) to update data for the currently active chart without opening the full download dialog. AptiStockX renews daily data first and merges newer trading days into the local EOD CSV. If the current chart uses intraday data and intraday charts are unlocked, AptiStockX can also renew the matching intraday side file.
When Automatic Renew Data is enabled, open intraday charts refresh only during their selected regular or extended market session. Set each provider's Intraday auto-refresh interval on its tab in Setting > Data Provider Setting. Choices range from 15 seconds to 30 minutes, plus Manual only. Higher frequencies use provider API quota faster, especially with multiple open intraday charts; lower frequencies conserve quota. A short provider-specific grace period after the session closes captures the final bar. Manual Renew Data remains available at any time.
Reload Saved Data
Use View > Reload Saved Data (or press F5) to reload the active chart from the locally saved data file. The chart keeps its workspace settings and moves the visible range to the latest bars when reloading downloaded symbol data. This is useful after:
Manually editing a local CSV data file
Switching from one download provider to another
Restoring a previously downloaded dataset
Intraday Data
Intraday periods (1m, 5m, 30m, 1h) require intraday data to be downloaded separately from end-of-day data. The Download Stock Data dialog requests 1-minute intraday data; AptiStockX derives higher intraday periods from the saved intraday data where possible. Intraday data support varies by provider:
Period
Notes
1 Minute
Requires a provider that supports 1-minute intraday data
5 Minutes
Derived from saved intraday data where possible
30 Minutes
Derived from saved intraday data where possible
1 Hour
Derived from saved intraday data where possible
If intraday data is not available locally, selecting an intraday period can start an intraday download for the active symbol.
Intraday charts use subtle alternating backgrounds for consecutive New York trading dates. The bands adapt to Bright and Dark appearance modes and make session boundaries easier to see.
Data Provider Settings
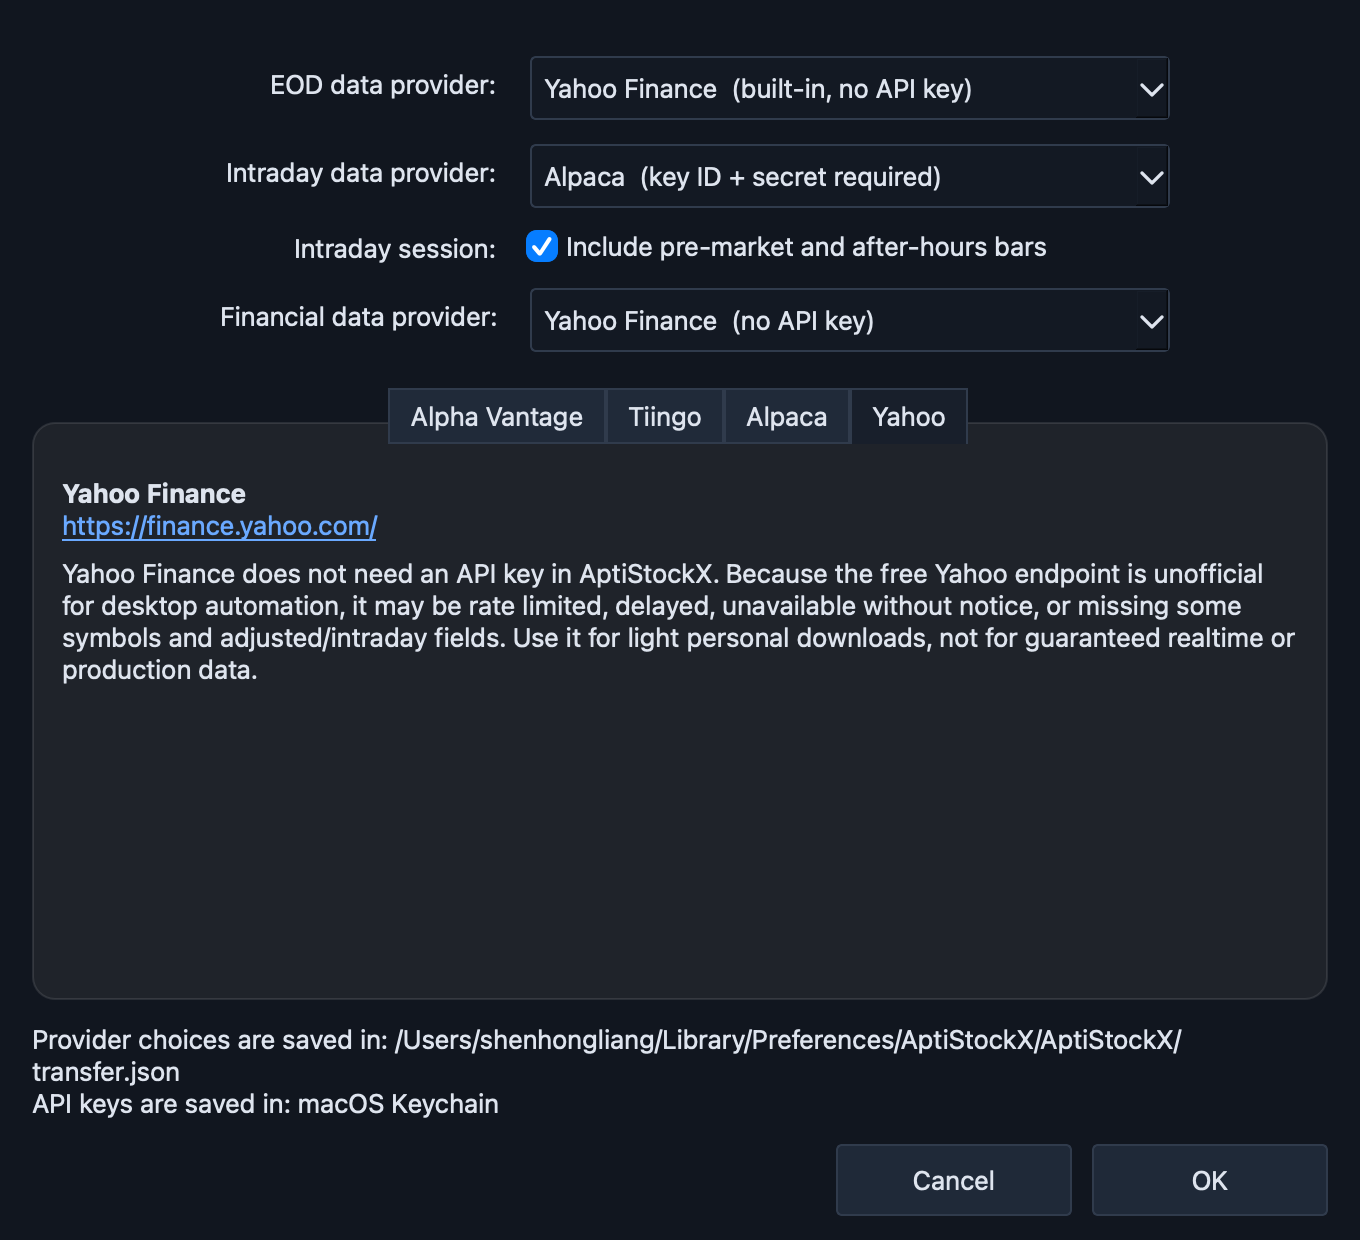
Open Setting > Data Provider Setting to configure API keys and provider-specific options.
Supported providers:
Provider
Notes
Alpha Vantage
API key required; Free Tier Compatible and Premium modes
Tiingo
API token required; supports daily, intraday, and quote paths. Free and Power plans limit fundamentals to Dow 30 symbols; broader fundamental coverage requires Tiingo's Fundamental Data API add-on
Alpaca
Key ID and secret key required; supports daily, intraday, and quote requests
Yahoo Finance
Native built-in path with no API key; supports Yahoo EOD data and supported fundamentals without external Python
API keys are stored in the operating system credential store when available.
Each provider tab has an independent Intraday auto-refresh setting. The provider defaults are 15 seconds for Alpaca, 1 minute for Tiingo, and 5 minutes for Alpha Vantage. Choose a slower interval or Manual only when the provider plan has a small request quota. These choices are saved in AptiStockX.json and restored on the next launch.
The Intraday session option controls whether charts and downloads use regular-session bars only or include available pre-market and after-hours bars. After changing the active EOD provider, intraday provider, or intraday session, AptiStockX asks whether to reload currently open charts using the new settings. A chart remains unchanged when its selected-provider dataset has not been downloaded.
Local Data Storage
Downloaded data is stored under AptiStockX's configured parent directory. Use Setting > Default Directory Setting to view or change it.
Files are stored by provider so histories from different sources are never silently combined. Each EOD and intraday CSV has a neighboring .meta.json file that records its provider, feed, session policy, refresh time, and bar coverage.
AptiStockX 3.0 governs intraday data using the US equity calendar in America/New_York: trading weekdays and holidays, daylight-saving changes, and supported half trading days. Regular-session files contain 9:30 AM to 4:00 PM ET bars. When Include pre-market and after-hours bars is enabled, extended-session files contain available bars from 4:00 AM to 8:00 PM ET. Regular-only and extended-session histories are stored separately and never silently combined.
Governed intraday CSV timestamps are saved in UTC. By default, AptiStockX converts those timestamps to America/New_York for chart labels, so a summer CSV timestamp such as 13:30Z displays as 09:30. Use Setting > Option > Display > Intraday chart time to show labels in stock-exchange time or the computer's local time.
The active chart status identifies its source. Hover over it to see refresh time, missing-bar count, and the extended-hours policy. Refresh always uses the provider recorded in the sidecar; AptiStockX does not silently fall back to another provider.
Chart period buttons route to the configured source for that period family. For example, a Yahoo Finance EOD chart switches to the configured Alpaca intraday dataset when 1 Minute is selected, and switches back to the configured EOD dataset for Day, Week, or Month. The datasets remain separate on disk.
Saved .acht charts remain in the configured Chart directory. Provider-governed saved charts store their chart layout and period with a configured-source policy, so reopening one resolves data from the providers currently selected in Data Provider Setting. The saved viewport and drawing studies are restored by trading date or timestamp, allowing them to remain aligned when providers offer different history lengths. Saved charts based on manually imported CSV files continue to reopen that exact CSV.
CSV Import
Use CSV import when you already have historical stock data in a local file. AptiStockX can open standard OHLCV CSV files directly as charts without a network connection.
Open a CSV File
Choose File > Open CSV (or press Ctrl+O).
Navigate to the CSV file in the file picker dialog.
Click Open. AptiStockX reads the file and opens it as a new chart window.
Supported CSV Format
AptiStockX accepts normalized AptiStockX CSV, common six-column daily CSV, MetaStock-style CSV, and AptiStockX intraday CSV.
For normalized EOD data, AptiStockX writes and reads this header:
date,open,high,low,close,volume,adjusted_close
For common daily CSV imports, the supported columns are:
Column name
Required
Description
Date
Yes
Bar date for daily/weekly/monthly data
Open
Yes
Opening price
High
Yes
High price
Low
Yes
Low price
Close
Yes
Closing price
Adj Close or adjusted_close
Optional
Adjusted close when available
Volume
Recommended
Trade volume; treated as zero if missing
Date Format
End-of-day CSV files should use YYYY-MM-DD dates (for example: 2024-01-15).
Intraday CSV files should use a Datetime or timestamp header with YYYY-MM-DDTHH:MM:SS or YYYY-MM-DD HH:MM:SS values.
Remove any currency symbols, commas in numbers, or extra quotes
Volume column ignored
Column named differently (e.g., Vol instead of Volume)
Rename the column to Volume
Empty rows
Blank lines in the file
Remove blank rows
Wrong encoding
File uses Windows-1252 or other non-UTF-8 encoding
Re-save the file as UTF-8
Intraday not recognized
Header or timestamp format does not look like intraday data
Use Datetime,Open,High,Low,Close,Volume with YYYY-MM-DDTHH:MM:SS or YYYY-MM-DD HH:MM:SS timestamps
After Opening
Once open, the CSV chart behaves like any other chart. You can:
Add indicators and drawing studies
Change the chart style and period
Save the chart as a .acht file with File > Save Chart
Use the OHLCV data dock to inspect individual bar values
Indicators
AptiStockX includes built-in technical indicators plus the Customer Indicator workflow for user scripts. Built-in indicators can be added to the main chart pane as overlays or to dedicated sub chart panes below the price chart.
Insert Menu
Use the Insert menu to access all indicator commands.
Main Chart Indicators
Main chart indicators are drawn directly over the price chart as overlays. Use Insert > Main Chart Indicator to add one.
Available main chart indicators include:
Indicator
Abbreviation
Description
Simple Moving Average
SMA
Arithmetic mean of closing prices over N periods
Exponential Moving Average
EMA
Weighted moving average that reacts faster to recent prices
Volume Weighted Moving Average
VWMA
Moving average weighted by volume
Bollinger Bands
BOL
Price envelope around a moving average
Keltner Channels
KC
Volatility-based envelope using ATR around an EMA
Moving Average Envelope
MAE
Fixed percentage envelope above and below a moving average
Parabolic SAR
SAR
Trailing stop-and-reverse dots for trend direction
Volume Profile
VP
Horizontal volume histogram showing price levels with most activity
Simple Moving Average (SMA)
Exponential Moving Average (EMA)
Volume Weighted Moving Average (VWMA)
Bollinger Bands
Keltner Channels
Moving Average Envelope
Parabolic SAR
Volume Profile
---
Sub Chart Indicators
Sub chart indicators appear in separate panes below the main price chart. Use Insert > Sub Chart Indicator to add one.
Available sub chart indicators include:
Indicator
Abbreviation
Description
Volume
VOL
Bar chart of trade volume; color-coded up/down
Stochastic
STC
%K and %D oscillator comparing close to recent high-low range
Moving Avg Conv Div
MACD
Moving Average Convergence Divergence with histogram
Avg Directional Index
ADX
Trend strength indicator using +DI, -DI, and ADX lines
Average True Range
ATR
Volatility measure based on true range
Comm Channel Index
CCI
Deviation from a statistical mean as an oscillator
Momentum
MTM
Rate of price change over N periods
Rate of Change
ROC
Percentage price change over N periods
Money Flow Index
MFI
Volume-weighted RSI based on typical price and volume
On Balance Volume
OBV
Running total of volume added on up days and subtracted on down days
Relative Strength Index
RSI
Momentum oscillator measuring speed and magnitude of price movements
Williams %R
WR
Stochastic-style oscillator from -100 to 0
Volume
Stochastic
MACD
ADX
Average True Range (ATR)
CCI
Momentum (MTM)
Rate of Change (ROC)
Money Flow Index (MFI)
MFI uses a locked 0-100 pane scale. The default overbought line is 80% and the default oversold line is 20%. Each reference line can be shown or hidden and styled independently.
On Balance Volume (OBV)
RSI
Use the Overbought and Oversold settings to show or hide fixed horizontal reference lines in the RSI pane. Level values are percentages: 70% draws the overbought line at the 70 position on the locked 0-100 RSI scale. Each level line can use its own color and solid, dot, dash, dash-dot, or dash-dot-dot style.
Williams %R
Williams %R uses a locked -100 to 0 pane scale. The default overbought line is -20% and the default oversold line is -80%. Each reference line can be shown or hidden and styled independently.
---
Indicator Parameters Dialog
Press F2 or choose Insert > Indicator Parameters to open the full indicator parameter dialog. This dialog shows all indicators currently on the chart and lets you edit their parameters, colors, and line styles.
Remove Indicators
Edit > Delete All Indicators — removes all indicators from the active chart
Insert > Remove All Indicators — same command from the Insert menu
Select an individual indicator and press Delete to remove only that indicator
Customer Indicators
Customer Indicators allow users to create and run custom indicator scripts directly in AptiStockX. Scripts are written in the AptiStockX scripting language and can access OHLCV price data, built-in functions, and mathematical operations.
Customer Indicator Selector
Use Insert > Customer Indicator or press F3 to open the Customer Indicator selector dialog. This dialog lists scripts from User Custom Indicators, previews the selected script, and lets you insert it into the main pane or a subpane.
Customer Indicator Editor
Use Setting > Customer Indicator Editor, press F6, or click the Customer Indicator Editor toolbar button to open the script editor.
Editor Workflow
Create or open a script — click New to start a blank script, Open to load an existing script, or double-click a script in the tree.
Write the script — enter formulas using the AptiStockX customer-indicator language.
Use helper panels — insert price constants, operators, drawing styles, and function templates from the editor's helper controls.
Check syntax — click Check Syntax to catch empty scripts, unmatched parentheses, unterminated strings, placeholder braces, and suspicious line endings before saving.
Save — click Save or Save As to store the script as a .txt file.
Insert from the selector — open Insert > Customer Indicator, select the script, then click Insert Mainpane or Insert Subpane.
Scripting Language Reference
The AptiStockX customer-indicator language is compatible with the legacy AptiStock/FEdit formula style. Scripts use price/date constants, formula assignments, built-in functions, and Set(...) style lines to control how output curves are drawn.
Price and Date Constants
Constant
Description
OPEN, HIGH, LOW, CLOSE
Price series
O, H, L, C
Short aliases for open, high, low, close
VOLUME, VOL, V
Volume series
ADJO, ADJH, ADJL, ADJC
Adjusted OHLC series when adjusted data is available
AMOUNT
Amount/turnover series when available
DATE, YEAR, MONTH, WEEK, DAY, DAYOFMONTH
Date-related values
Assignments and Output Curves
Use := or = for intermediate values. A line in the form NAME:EXPRESSION; marks NAME as an output curve.
N := 20;
CUSTOM:MA(CLOSE,N);
For multiple curves, define multiple named outputs:
FAST:MA(CLOSE,10);
SLOW:MA(CLOSE,30);
Built-in Functions
Function
Description
MA(array, period)
Moving average
EMA(array, period)
Exponential moving average
SMA(array, period, weight)
Smoothed moving average
HHV(array, period) / LLV(array, period)
Highest high / lowest low over a period
STD(array, period)
Standard deviation
SUM(array, period)
Rolling sum
REF(array, offset)
Value shifted back by offset bars
CROSS(a, b)
Cross-above test
IF(condition, then, else)
Conditional value
SUPERTREND(period, multiplier)
ATR-based SuperTrend trailing line
SUPERTRENDDIR(period, multiplier)
SuperTrend direction; 1 for uptrend and -1 for downtrend
Custom indicator scripts are stored in the application data folder:
User Custom Indicators:<Qt AppDataLocation>/custom_indicators/
Each script is saved as a UTF-8 plain text .txt file. The editor can open a .txt script from any location, but the selector tree only lists scripts in the user custom-indicator folder.
The bundled script library is organized with these subfolders:
Folder
Contents
default/main/
AptiStockX main-pane indicator scripts such as moving averages, Bollinger Bands, Keltner Channels, envelopes, and Parabolic SAR
default/sub/
AptiStockX sub-pane indicator scripts such as MACD, RSI, ATR, ADX, CCI, MFI, OBV, Stochastic, Momentum, ROC, Volume, and Williams %R
default/popular/
Popular indicators from other platforms that translate cleanly to AptiStockX script, including SuperTrend, Donchian Channels, Aroon, CMF, Chaikin Oscillator, PPO, Stochastic RSI, and WaveTrend
Indicator/
Legacy FEdit/AptiStock scripts with comment headers that describe each formula
Current Limitations
Feature
Status
Basic arithmetic and comparison operators
Supported
Built-in MA, EMA, SMA, HHV, LLV, STD, SUM, REF, CROSS
Supported
Multiple output curves
Supported
Script parameters (Param)
Not used by the current editor workflow
String handling
Not supported
External data access
Not supported
Recursive / self-referencing formulas
Partially supported
Legacy AptiStock/FEdit formula compatibility
Supported for the implemented expression/function set
Drawing Tools
Drawing tools let you annotate charts with trend lines, channels, Fibonacci studies, Gann tools, geometric shapes, and text labels. All drawing studies are saved with the chart in the .acht file.
Drawing Toolbar
The Drawing toolbar provides one-click access to all drawing tools. Click a tool button to activate it, then click and drag on the chart to draw.
All drawing tools are also accessible from the Insert menu.
How to Draw
Click the desired tool button in the Drawing toolbar (or choose it from the Insert menu).
Click and drag on the chart to place the study. Tools that require three anchors remain active until the third point is placed.
Release or place the final anchor to finish drawing. AptiStockX normally returns to the pointer after one study; enable Edit > Keep Drawing Mode to place more studies of the same type.
Double-click an existing study to open its settings dialog and adjust appearance.
Press Esc to cancel an active drawing tool.
---
Basic Drawing Tools
Trend Line
Draws a straight line between two price/time anchor points. Commonly used to identify support, resistance, and trend direction.
Trend Ray
Draws a line from the first anchor through the second anchor and continues it indefinitely to the right. Use a Trend Ray when support, resistance, or a trend begins at a known point and should project into future bars. Trend Ray is available in Basic and Pro.
Extended Line
Draws through two anchors and continues indefinitely in both directions. This is useful when the relationship between two points should be projected backward as well as forward. Extended Line is available in Basic and Pro.
Info Line
Measures the move between two anchors and displays the signed bar count, elapsed time, price change, percentage change, and price-per-bar slope in an overlay. Daily, weekly, and monthly charts show elapsed calendar days; intraday charts show a formatted duration. Add an optional label in the study settings. Info Line is available in Basic and Pro.
Trend Arrow
A trend line with an arrowhead at one end to indicate direction.
Horizontal Line
Draws a horizontal line at a fixed price level across the entire chart. Useful for marking key support and resistance price levels.
Vertical Line
Draws a vertical line at a fixed date/time across all chart panes. Useful for marking significant dates such as earnings announcements or economic events.
Cycle Lines
Places evenly spaced vertical lines to mark repeating time cycles.
Rectangle
Draws a shaded or outlined rectangular region on the chart to highlight a price-time area.
Ellipse
Draws an ellipse to highlight a price-time area.
Triangle
Draws a triangle connecting three anchor points.
Text
Places a text label at any position on the chart.
---
Fibonacci Tools
Fibonacci tools are available from Insert > Fibonacci.
Fibonacci Arc
Draws circular arcs at Fibonacci ratio distances from a baseline drawn between two anchor points. Used to identify potential reversal zones.
Fibonacci Fan
Draws diagonal fan lines from a single origin point at Fibonacci angles (23.6%, 38.2%, 50%, 61.8%).
Fibonacci Retracement
Draws horizontal retracement levels between a swing high and swing low. The enabled defaults are 0%, 23.6%, 38.2%, 50%, 61.8%, and 100%. The settings dialog also includes 78.6%, 127.2%, 161.8%, and 261.8% levels; they are disabled by default and can be enabled individually.
Quadrant Lines
Divides the price range between two anchors into four equal areas using 0%, 25%, 50%, 75%, and 100% horizontal levels. Use it to compare where price sits within a move without applying Fibonacci ratios. Individual levels and colors can be changed in the settings dialog. Quadrant Lines is a Pro drawing tool.
Fibonacci Time Zone
Places vertical lines at Fibonacci time intervals (1, 1, 2, 3, 5, 8, 13, 21, 34...) from a starting bar.
---
Gann Tools
Gann tools are available from Insert > Gann.
Gann Line
Draws a 1×1 Gann angle line (45 degrees) from an anchor point, representing equal price and time movement.
Gann Fan
Draws multiple Gann angle lines (1×8, 1×4, 1×3, 1×2, 1×1, 2×1, 3×1, 4×1, 8×1) from a single origin.
Gann Box
Draws a Gann square/box overlay for time and price analysis.
---
Channel Tools
Channel tools are available from Insert > Channels.
Equidistant Channel
Draws two parallel trend lines at equal price distance above and below a baseline.
Standard Deviation Channel
Draws a linear regression line with upper and lower bands at a specified number of standard deviations.
Standard Error Channel
Similar to the Standard Deviation Channel, but uses the standard error of the regression rather than standard deviation of prices.
---
Other Analytical Tools
Pitchfork (Andrews' Pitchfork)
Draws three parallel lines from three anchor points forming a channel shape used to identify support and resistance zones.
Linear Regression
Draws a best-fit straight line through the selected price data range.
Speed Resistance Line
Draws 1/3 and 2/3 speed resistance lines from a significant swing high or low to identify likely support or resistance levels.
---
Edit and Delete Drawing Studies
Use the Edit menu to manage existing studies.
Command
Description
Edit > Delete All Line Studies
Removes all drawing studies from the active chart
Edit > Duplicate Selected Line Study
Copies the selected study with a small offset, preserving its type, anchors, label, levels, colors, style, extension, and lock state
Edit > Keep Drawing Mode
Keeps the current drawing tool active after a study is completed so you can place repeated studies
Click a study + Delete key
Removes the selected study only
Double-click a study
Opens the study settings dialog to edit color, style, and parameters
Esc
Cancels the currently active drawing tool
To duplicate a study, select it on the chart and choose Edit > Duplicate Selected Line Study. The command is disabled until a study is selected. Move or edit the copied study independently of the original.
Keep Drawing Mode applies to toolbar and Insert menu tools. Turn it off or press Esc when you want AptiStockX to return to the normal pointer after the current placement.
Watchlist
The Watchlist dock lets you track named lists of ticker symbols and monitor their latest quotes without opening each chart individually. Quotes refresh automatically while the application is running.
Show or Hide the Watchlist
Choose View > Show Watchlist Panel from the menu bar, or
Press F7, or
Click the Watchlist button on the main toolbar.
The Watchlist dock can be docked to any edge of the main window or floated as a separate panel.
Watchlist Columns
Column
Description
Symbol
Ticker symbol (e.g. AAPL, MSFT)
Last
Most recent quote price, or -- until a quote is available
Updated
Local time of the most recent quote update
The Symbol column also uses tooltips to show the company name, market, quote price, update time, and delayed-data note when available.
When the Watchlist dock is widened, AptiStockX automatically wraps long watchlists into additional Symbol/Last/Updated column groups. Narrowing the dock returns the watchlist to a single column group.
Add a Symbol
Open the Watchlist dock.
Right-click in the watchlist to open the context menu and choose Add Symbol, or use Setting > Watchlist Edit.
Type the ticker symbol and press Enter.
The symbol appears in the list. Its quote refreshes on the next update cycle.
Edit the Watchlist
Use Setting > Watchlist Edit to open the watchlist editor. From here you can:
Add new symbols
Remove existing symbols
Reorder the list by dragging entries
The dock also has a List selector plus New and Delete buttons for managing multiple watchlist CSV files.
Open a Chart from the Watchlist
Single-click a symbol to load it in the active chart. Double-click a symbol to open it as a new chart window. Right-click a symbol to choose Open in Active Chart, Open as New Chart, or Open as Detached Chart from the context menu.
If an exact saved chart named SYMBOL.acht exists in the configured Chart directory, AptiStockX loads that chart file first. The chart always uses the configured data provider for the active display period and starts a download if that exact dataset is not available locally.
When a symbol replaces the stock in the current chart window, AptiStockX keeps the current display period and approximate visible-bar count, then moves the new symbol to its latest bars. A matching saved chart still supplies that symbol's indicators, studies, and visual settings. Opening an .acht file directly continues to restore the period and viewport saved in that file.
Sort the Symbol Column
Click the Symbol column header to cycle the watchlist display order:
A-Z
Z-A
CSV order
CSV order means the order stored inside the current watchlist .csv file. The selected sort mode is saved in last_session_workspace.json and restored the next time AptiStockX opens.
Refresh Quotes
Quotes refresh automatically at a provider-aware background interval while the app is running. Alpaca snapshots refresh every minute. Tiingo watchlists refresh at least every five minutes and slow down further for large lists because the current Tiingo path uses one request per symbol and shares the account's hourly request allocation with charts, fundamentals, and downloads. Alpha Vantage refreshes every 15 minutes in Premium mode and hourly in Free Tier Compatible mode. To force an immediate refresh:
By default, the Watchlist quote provider follows the selected intraday provider. Use Setting > Data Provider Setting > Watchlist quote provider to choose a different source.
Right-click in the watchlist and choose Refresh from the context menu.
Watchlist Storage
Watchlists are saved to the application data folder:
<Qt AppDataLocation>/watchlists/<list name>.csv
Older builds used a single watchlist.csv; AptiStockX copies that file into the named-watchlists folder when needed. Each watchlist file is plain CSV and can be edited in any text editor.
Global Market Stock Viewer
The Global Market Stock Viewer lets you browse AptiStockX's installed stock-symbol catalog by market, search it offline, and open or download a selected symbol. The catalog stores both exchange-native symbols and Yahoo-compatible symbols so you can identify a listing before loading its chart.
Open the Viewer
Choose View > Show Global Market Stock Viewer or click the Global Market button on the main toolbar. The viewer opens as a dock on the right side of the main window.
The viewer contains:
Control
Purpose
Market selector
Chooses a country or exchange group. All Selected Markets searches every group enabled in Market Group Settings.
Search
Filters the installed catalog by symbol or company name without a network request.
Filter
Shows or hides stocks and indexes, ETFs, REITs, funds, and other securities. Stocks and indexes are enabled by default.
Native Symbol
Shows the symbol used by the listing exchange.
Yahoo Symbol
Shows the provider-compatible symbol AptiStockX uses to load and download data.
Name and Type
Identify the company/security and instrument class.
Drag a column boundary in the table header to resize that column.
Open, Download, or Watch a Symbol
Single-click a row to load the symbol in the active chart. If no chart is open, AptiStockX creates one.
Double-click a row to open it as a new chart in Pro. Basic loads it in the active chart.
Right-click a row for Open in Active Chart, Open as New Chart, Download Symbol, and Add to Watchlist.
Opening a catalog entry uses the Yahoo Symbol shown in the table. Download Symbol opens the standard Download Stock Data dialog with that symbol filled in; choose the data range and provider there before downloading.
Dock or Float the Viewer
Drag the viewer by its title bar to dock it on the left or right side of the main window. Drag it away from a docking edge to use it as a floating window. Double-clicking the title bar also toggles between the last docked position and a floating window.
Closing the floating viewer hides it; reopen it from View or the toolbar.
Market Group Settings
Open the market selector and choose Market Group Settings, or choose Download > Update Global Market Stock List.
Use this dialog to:
Choose the market group shown when AptiStockX starts.
Choose which market groups appear in the viewer menu in Pro.
Click Update to check for and download a newer catalog immediately.
Enable or disable the automatic once-per-day update check.
Basic can browse one selected market group at a time; its visible group follows the default group. Pro can expose multiple groups and use All Selected Markets. Manual ticker entry and the Download Stock Data dialog remain available for Yahoo-supported symbols outside the visible catalog group.
Catalog Updates and Offline Use
AptiStockX includes a bundled fallback catalog, so browsing and searching work without a network connection. A successful update is saved locally and used on later launches. Downloads are compressed and checked against the catalog manifest's size and SHA-256 value before AptiStockX replaces the installed catalog. If an update fails, the existing local or bundled catalog remains available.
Workspaces and Files
AptiStockX uses three related saved states: individual chart files (.acht) that preserve one chart's symbol, period, indicators, studies, and visual settings; chart workspace JSON files that apply reusable chart settings to the active chart; and full session workspace JSON files that preserve multiple MDI and detached chart windows.
File Menu
---
Chart Files (.acht)
A chart file stores everything about a single chart:
The ticker symbol
The selected chart period (Daily, Weekly, 1h, etc.)
The chart style (Candlestick, Line, OHLC, Heikin-Ashi, etc.)
All active indicators and their parameters
All drawing studies and their positions
The visible range and visual chart settings
Open a Chart File
File > Open Chart (Ctrl+Shift+O) — opens a .acht file from disk.
Save a Chart File
File > Save Chart (Ctrl+S) — saves the active chart to its current file path.
File > Save Chart As — saves a copy to a new file path.
Chart files use JSON format (v3). Older v1 and v2 .acht files are loaded gracefully.
Symbol Auto-Load from the Chart Directory
When you type or select a symbol, AptiStockX first checks the configured Chart directory for an exact file named SYMBOL.acht, such as AAPL.acht. If that exact file exists, it is loaded directly. Files in other directories or differently named files such as AAPL-chart.acht are ignored by this automatic lookup.
---
Workspaces
A workspace is saved as JSON in the configured Workspace directory. When more than one chart or a detached chart is open, File > Save Workspace asks whether to save:
Current Chart Workspace — reusable chart settings for the active chart.
Full Session Workspace — all open MDI and detached chart windows, their symbols, positions, and layout state.
Open a Workspace
File > Open Workspace — opens a previously saved workspace JSON file. A chart workspace applies to the active chart, while a full session workspace restores its saved chart windows.
Save a Workspace
File > Save Workspace — saves the current window layout to a workspace file.
File > Save as Default Workspace — saves the active chart's workspace settings as default_workspace.json.
The last session is also saved automatically to last_session_workspace.json in the AptiStockX system directory and restored on the next launch when available.
---
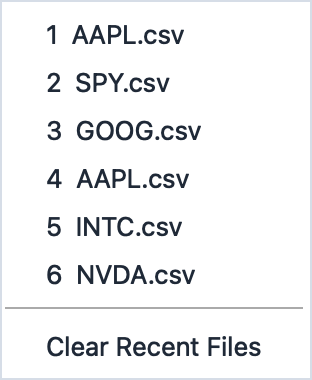
Recent Files
Recently opened chart files and CSV files are listed in File > Recent Files.
Click any entry in the recent files list to reopen it immediately.
---
MDI Window Arrangement
Use the Window menu to arrange chart sub-windows in the MDI area.
Command
Description
View > Tabbed View
Switches to tabbed MDI mode so charts share one area with tabs
View > Cascade Windows or Window > Cascade
Cascades chart windows in a staggered arrangement
View > Tile Windows or Window > Tile
Tiles chart windows
Window > Duplicate Active Chart in New Window
Creates a detached copy of the active chart
The active window arrangement is preserved in the workspace file when you save a workspace.
Multiple Monitor Support
AptiStockX supports multi-monitor workflows, allowing you to display chart windows across multiple physical displays for expanded workspace and side-by-side analysis.
Overview
The main application window and its MDI area (containing tabbed or tiled charts) remain on your primary monitor. Detached chart windows are standalone windows that can be positioned on secondary monitors, maximizing viewing real estate for detailed technical analysis across your full display setup.
---
Creating Detached Chart Windows
A detached chart window is a standalone chart that floats independently of the main MDI area.
Duplicate a Chart as Detached
Open the chart you want to duplicate.
Right-click in the chart area and select Duplicate Chart in New Window, use Window > Duplicate Active Chart in New Window, or press F9.
A new detached chart window opens, offset from the main workspace.
You can now drag it to any connected monitor.
The detached window operates independently — changes to indicators or zoom level on the detached window do not affect the original chart in the MDI area, and vice versa.
---
Managing Detached Windows
Move a Detached Window to Another Monitor
Detached chart windows behave like any standard application window:
Click and drag the title bar to move the window to another monitor.
Use keyboard shortcuts to move windows between displays (OS-dependent).
The window position and size are preserved when you save a workspace.
Close a Detached Window
Click the close button in the window title bar. You will be prompted if unsaved chart changes need attention.
---
Automatic Multi-Monitor Layouts
AptiStockX provides automatic arrangement modes for standard dual- and triple-monitor setups.
Arrange for Dual Monitor
Window > Arrange for Dual Monitor
This command:
Positions the main AptiStockX window on your primary monitor, filling the available space.
Creates one detached chart window (if needed) and positions it to fill your secondary monitor.
Requires a chart to be open and at least two monitors connected.
Use case: Monitor price action on a detailed chart on one screen while keeping the main application interface accessible on another.
Arrange for Triple Monitor
Window > Arrange for Triple Monitor
This command:
Positions the main AptiStockX window on your primary monitor.
Creates two detached chart windows (if needed) and positions them to fill your second and third monitors.
Requires at least three monitors connected.
Use case: Simultaneously monitor three different stocks or timeframes across three displays.
---
Bringing Detached Windows Back
If a detached window moves off-screen or becomes unreachable:
Window > Bring Detached Windows to Main Monitor
This command repositions all detached windows to visible locations on your primary monitor, arranged in a cascading pattern.
---
Saving and Restoring Multi-Monitor Layouts
When you save a Full Session Workspace JSON file, the positions, sizes, and monitor assignments of detached windows are preserved.
Save a Multi-Monitor Layout
Arrange your charts and detached windows as desired across your monitors.
Choose File > Save Workspace, choose Full Session Workspace when prompted, and give the layout a name.
To automatically load this layout on the next application launch, select File > Save as Default Workspace.
Restore a Multi-Monitor Layout
File > Open Workspace — reopen a previously saved full session workspace, restoring all detached window positions.
Note: If a monitor was connected at the time of saving but is no longer available, detached windows will be repositioned to visible areas on the current monitor setup.
---
Tips and Workflow
Dual setup (price + analysis): Use the main window for detailed technical analysis and drawing tools on one monitor, and a detached window to monitor live price action on another.
Triple setup (watchlist + analysis + detail): Position the main window on monitor 1 for watchlist and settings, a medium-term chart on monitor 2, and an intraday chart on monitor 3.
Independent zoom/navigation: Detached windows can be zoomed and scrolled independently, allowing simultaneous views of different time ranges of the same or different symbols.
Session restore: Even if detached windows are scattered across multiple displays when you close the app, they will restore to their saved positions on the next launch.
AI Assistant Chart Reading
AptiStockX includes an integrated AI Assistant powered by OpenAI-compatible APIs. The AI Assistant provides chart and selected-indicator explanations using structured chart context, helping you review price patterns, momentum, volume dynamics, indicators, and visible support/resistance areas.
---
Overview
The AI Assistant analyzes the current chart window and generates concise, actionable insights. It examines:
Price trends and momentum — identifying uptrends, downtrends, and consolidation patterns
Volume profile — analyzing volume spikes and volume-weighted price movements
Indicator readings — explaining what active technical indicators (RSI, MACD, Bollinger Bands, etc.) are signaling
Support and resistance — identifying potential price support and resistance zones from the visible chart
Risk factors — noting potential risks or limitations based on what's visible on the chart
The AI Assistant operates entirely on the visible chart context — it never invents data and includes disclaimers that its analysis is educational, not investment advice.
---
Enabling and Configuring the AI Assistant
Show the AI Assistant Panel
View > Show AI Assistant Panel,
press F8, or
Click the AI Assistant toolbar button.
The AI Assistant panel opens as a docked widget on the right side of the main window. It can be docked on any side or floated as a separate panel.
Configure AI Settings
Choose Setting > AI Assistant Setting… from the menu bar, or click Settings... in the AI Assistant panel.
Configure the following:
Setting
Description
Enable AI Assistant
Toggle the AI Assistant on/off
Provider
OpenAI-compatible API or Local OpenAI-compatible API
API base URL
The endpoint for your AI provider, such as https://api.openai.com/v1 or http://localhost:1234/v1
Model
The model to use (e.g., gpt-4o-mini, claude-3-5-sonnet, etc.)
API key
Your API key; leave blank to keep the saved key
Clear saved AI API key
Removes the saved key
Allow sending symbol and structured chart context to cloud AI providers
Allows cloud AI providers to receive symbol and structured chart context. This is disabled by default.
Managing Your API Key
Your API key is stored securely in your system's credential storage:
macOS: OS Keychain
Windows: Windows Credential Manager
Linux: System credential store
The API key is never written to disk in plain text.
---
Using Chart Explanation
Chart Explanation analyzes the entire visible chart and provides a structured breakdown of the price action.
Request a Chart Explanation
Open a chart (any symbol, period, or style).
Open the AI Assistant panel if not already visible.
Click Explain Current Chart.
The AI Assistant will analyze the chart and return a response.
What You'll See
The AI Assistant returns an explanation organized into sections:
Summary — overall trend and market character (bullish, bearish, or sideways)
Trend and Momentum — primary trend direction and recent momentum signals
Volume — volume profile and any significant volume patterns
Possible Support / Possible Resistance — zones where price may find support or resistance
Potential Risks — limitations or factors to watch
Disclaimer — reminder that this is educational analysis, not investment advice
Example response:
Summary
The chart shows a sustained uptrend with consolidation near the highs.

Trend and Momentum
Price is in a higher-high, higher-low pattern. Momentum indicators appear
positive but may be overbought on shorter timeframes.

Volume
Volume spikes coincide with breakouts above key resistance levels, suggesting
institutional participation in the uptrend.

Possible Support / Possible Resistance
Watch the $150 level for support. Potential resistance near $160.

Potential Risks
Extended moves in one direction may pull back sharply. Watch for divergences
between price and volume.

Disclaimer
This analysis is educational only and does not constitute investment advice.
---
Using Indicator Explanation
Indicator Explanation focuses on a selected technical indicator, explaining what it measures and how it relates to the current price action.
Request an Indicator Explanation
Add a technical indicator to your chart from Insert > Main Chart Indicator or Insert > Sub Chart Indicator.
Click the indicator to select it (a blue border appears around the indicator).
Right-click and select Explain Selected Indicator with AI, or use Explain Selected Indicator in the AI Assistant panel.
The AI Assistant will explain the selected indicator.
What You'll See
The AI Assistant returns an explanation organized into sections:
What the Indicator Measures — the purpose and mathematical basis of the indicator
Current Reading — the current value(s) of the indicator and what that means
How It Relates to the Visible Chart — interpretation in the context of price action
Limitations / Risks — when the indicator may be unreliable or misleading
Disclaimer — reminder about educational use
Example response:
What the Indicator Measures
The Relative Strength Index (RSI) measures the magnitude of recent price
changes to evaluate overbought or oversold conditions.

Current Reading
The RSI is at 72, which is typically considered overbought (above 70).

How It Relates to the Visible Chart
Price is near a 3-month high, and the overbought RSI suggests momentum may
be weakening. However, strong uptrends can persist with overbought RSI.

Limitations / Risks
RSI overbought signals are less reliable in strong trends. Also, divergences
(price makes new highs while RSI makes lower highs) are more significant
than overbought levels alone.

Disclaimer
This explanation is educational and not investment guidance.
---
AI Response Status
Waiting for a Response
When you request an explanation, the AI Assistant shows Generating... while the request is being sent to the AI provider.
Canceling a Request
Click the Cancel button to stop waiting for a response.
Error Messages
Common error messages and what they mean:
Error
Cause
Solution
API key not configured
No API key has been saved
Go to Setting > AI Assistant Setting and add an API key
Network timeout
The AI provider took too long to respond
Check your internet connection; try again or increase the timeout setting
Invalid API key
The saved API key is incorrect or expired
Update the API key in AI Assistant settings
Rate limit exceeded
You've made too many requests in a short time
Wait a few minutes and try again
Provider unreachable
The AI provider URL is incorrect or the service is down
Check the API Base URL setting and verify the provider is online
---
Supported AI Models
The AI Assistant works with any OpenAI-compatible API. Popular options include:
OpenAI-compatible APIs (for example, gpt-4o-mini) — https://api.openai.com/v1
Anthropic Claude (via OpenAI-compatible router) — varies by provider
Local LLMs (via Ollama, LM Studio, vLLM) — for example http://localhost:1234/v1
Use a model that supports chat completions through an OpenAI-compatible endpoint. Local providers are a good fit when you want chart context to stay on your machine.
---
Tips and Best Practices
Fresh perspective: Use Chart Explanation before trading to validate your own analysis or discover patterns you might have missed.
Learning tool: Use Indicator Explanation to understand unfamiliar indicators without leaving the charting application.
Timeframe matters: Run explanations on multiple timeframes (daily, weekly, intraday) to see how the narrative changes across different perspectives.
Cross-check with price: The AI sees only what's on the chart. If important data occurred off-screen or pre-chart, the analysis is incomplete.
Data privacy: If you configure a local AI provider (Ollama, LM Studio), all chart data stays on your computer. For cloud providers, verify their privacy policy.
---
Limitations and Disclaimers
The AI Assistant:
Is educational, not investment advice — never guarantees future price movement or recommends buy/sell actions
Analyzes only visible data — it cannot see volume at specific price levels, off-chart news, or intraday nuances outside the visible window
Can hallucinate — in rare cases, it may generate plausible-sounding but inaccurate interpretations; always verify its insights against the actual chart
Requires honest chart setup — if the chart's time period, symbol, or indicators are mislabeled or incorrect, the analysis will be misleading
Is subject to provider limits — rate limits, API costs, and provider outages may affect availability
Always conduct your own due diligence and combine AI insights with your own analysis and research.
Settings
Settings control chart appearance, behavior, data providers, Y-axis scaling, and chart defaults. Settings are accessed through the View menu, the Setting menu, and the Options dialog.
Setting Menu
---
Appearance — Bright and Dark Mode
Use View > Appearance to switch between Bright and Dark themes. The theme affects the chart background, grid color, bar colors, axis colors, and the application palette.
Mode
Description
Bright Mode
Light background with dark text and grid lines
Dark Mode
Dark background with light text and grid lines
The selected mode is saved and restored on the next application launch.
---
Cursor Style
Use View > Cursor Style to switch between the standard pointer and the crosshair cursor.
Option
Description
Cursor
Standard mouse pointer — click to select studies
Crosshairs
Full-chart crosshair with OHLCV hover box and indicator values
---
Y-Axis Scale Settings
Use View > Y-Axis Scale Setting to control how the vertical price axis is scaled.
Options include:
Linear Scale — standard price scale
Log Scale — logarithmic price scale
Expand in Y-Axis / Shrink in Y-Axis — toolbar and menu commands adjust vertical zoom
Y-Axis Setting — opens a dialog with Y-axis scale and vertical zoom controls
---
Options Dialog
Use Setting > Option to open the Options dialog. It has these pages:
Range size and Renko brick size when those chart styles are selected
Bar spacing and width defaults
Grid line visibility
Up/down bar colors
Display Page
Controls display and UI behavior defaults such as:
Price grid lines
Mouse crosshair display
OHLCV hover box display
Volume pane visibility default
Intraday chart time labels in stock-exchange time or the computer's local time
Intraday chart time defaults to Stock exchange time (America/New_York), so the normal US equity session is labeled from 9:30 AM to 4:00 PM ET. Choose Computer local time to label the same bars in the timezone configured by the operating system. This setting changes chart labels and hover/status times only; saved CSV timestamps remain UTC and trading-session governance remains in exchange time.
---
First-Run Terms and Privacy Choices
Before normal use begins, AptiStockX shows the current Terms of Use and the optional telemetry choice together. You must select the Terms agreement to continue. Optional usage telemetry is off unless you select it, and that choice can be changed later on the Privacy page. Minimal app-start and app-exit events are baseline product statistics and are sent independently of the optional usage-telemetry setting.
The Windows installer also displays the Terms of Use in its setup wizard. AptiStockX recognizes that installer acceptance on first launch, so Windows users are not asked to accept the same Terms twice.
Privacy Page
Controls optional privacy-preserving usage telemetry. The baseline app-start and app-exit events contain the app version, platform, Basic/Pro tier, UTC timestamp, and a locally generated installation ID. App start may also report whether a saved session was restored. Turning the Privacy option off immediately disables and clears queued optional events, but does not disable these two baseline lifecycle events.
Telemetry does not send stock symbols, watchlists, chart files, private files, provider credentials, license payloads, file paths, trading-account information, or AI prompts.
7-Day Pro Trial
On startup, Basic users who have not already activated a Pro Trial or Pro license are offered a 7-day Pro Trial. You can also open it later with Help > Start 7-Day Pro Trial.
Enter a valid email address. The one-trial acknowledgement is selected by default.
Click Send Code and retrieve the six-digit verification code sent to that address.
Enter the code and click Verify and Start Trial.
AptiStockX installs the signed trial license for this computer and enables Pro features immediately.
When a locked Pro feature is selected, its activation dialog also offers Start 7-Day Pro Trial, Buy Pro, and Activate / Import License. An active or expired trial is not offered again as a new trial.
AI Page
Controls the AI Assistant provider, base URL, model, API key, credential status, and whether cloud AI providers may receive symbol and structured chart context. Cloud chart-data sharing is disabled by default.
---
Data Provider Settings
Use Setting > Data Provider Setting to configure which market data providers are active and to enter API keys.
Use Intraday session to choose regular-hours-only charts or include available pre-market and after-hours bars. When the active EOD provider, intraday provider, or intraday session changes, AptiStockX offers to reload open charts using the new settings. Choosing No leaves current charts unchanged; the new settings apply when charts are reopened or their periods change.
Use Watchlist quote provider to choose the source for automatic Watchlist quotes. The recommended Same as intraday provider option switches Watchlist quotes immediately when the intraday provider changes. Selecting a separate provider keeps Watchlist quotes independent from intraday charts.
Each provider tab has its own Intraday auto-refresh selection. Choose from
15 seconds through 30 minutes, or choose Manual only. Higher refresh frequency uses provider API quota faster, especially when multiple intraday charts are open; lower frequency conserves quota. The provider-specific choices are saved in AptiStockX.json and restored automatically.
---
Default Directory Settings
Use Setting > Default Directory Setting to view or change the parent directory used for AptiStockX user data. AptiStockX derives these folders from the selected parent directory:
Data
Data/providers for provider-separated EOD, intraday, and fundamental data
Workspace
Chart
---
Delete AptiStockX Data
Use Setting > Delete AptiStockX Data only before uninstalling AptiStockX. Deleted data cannot be recovered.
Nothing is selected by default. The cleanup dialog offers separate choices for:
Downloaded market data
Saved charts and workspaces
Watchlists and custom indicators
Settings and telemetry history
The dialog explains what each selected category will delete. AptiStockX deletes only its managed folders and files; it never deletes the configured parent directory, charts and other files saved outside AptiStockX-managed locations, credentials stored in the operating system credential store, data-provider configuration, or the installed license. After confirmation, AptiStockX deletes the selected data and quits immediately without saving new session state.
On Windows, the AptiStockX uninstaller offers to run the same cleanup while preserving saved credentials. On macOS and Linux, run the in-app cleanup before deleting the application.
---
Chart Window Settings
Use Setting > Chart Window Setting to configure display defaults such as grid visibility, crosshair, OHLCV info box, volume pane visibility, and axis label font.
---
Price Curve Settings
Use Setting > Price Curve Setting to configure chart style, Range size, Renko brick size, bar width, and up/down colors.
---
Bar Limit Settings
Use Setting > Bar Limit Setting to control how many bars AptiStockX loads from very large files. When a file exceeds the configured limit, AptiStockX loads the most recent bars and shows a message explaining what was skipped.
---
Watchlist Edit
Use Setting > Watchlist Edit to add, remove, and reorder symbols in the Watchlist dock. See Watchlist for details.
---
Customer Indicator Editor
Use Setting > Customer Indicator Editor to open the script editor for custom indicators. See Customer Indicators for details.
Keyboard Shortcuts
File Commands
Shortcut
Command
Ctrl+N
New Chart
Ctrl+O
Open CSV
Ctrl+Shift+O
Open Chart (.acht file)
Ctrl+S
Save Chart
Ctrl+C
Copy Chart to Clipboard
Data Commands
Shortcut
Command
F1
Open AptiStockX Help Manual
F4
Renew Data for the active chart
F5
Reload Saved Data (reload active chart from local file)
Indicator Commands
Shortcut
Command
F2
Open Indicator Parameters dialog
F3
Open Customer Indicator selector
F6
Open Customer Indicator Editor
Chart Navigation
Shortcut
Command
Right Arrow
Move forward one bar
Left Arrow
Move backward one bar
Ctrl+Right Arrow
Quick forward (multiple bars)
Ctrl+Left Arrow
Quick backward (multiple bars)
Home
Jump to the beginning of the data
End
Jump to the end of the data (most recent bar)
Zoom and Scale
Shortcut
Command
Plus (+)
Broaden candle line
Minus (-)
Narrow candle line
Ctrl+Minus
View > Zoom In
Ctrl+Plus
View > Zoom Out
Drawing Tools
Shortcut
Command
Esc
Cancel the active drawing tool
Delete
Delete the selected study or indicator
Window Management
Shortcut
Command
F7
Show or hide the Watchlist panel
F8
Show or hide the AI Assistant panel
F9
Duplicate active chart in a detached window
Ctrl+W
Close the active chart window
Ctrl+F4
Close the active MDI sub-window
---
Note: Verify all shortcuts against the final release build menus. On macOS, Ctrl maps to the Command key in some contexts.
Troubleshooting
CSV File Does Not Open
Symptoms: File picker dialog closes but no chart window appears; an error message mentions missing columns or unrecognized format.
Steps to fix:
Open the CSV file in a text editor and verify it has a header row with at least Date, Open, High, Low, and Close columns.
Confirm the date format is YYYY-MM-DD (for example: 2024-01-15). Other formats may not be recognized.
Remove any blank rows, especially blank rows at the top or between data rows.
Ensure price and volume values are plain numbers without currency symbols ($), thousands separators (,), or extra quotes.
Re-save the file as UTF-8 encoding if it was created on Windows and may use Windows-1252 encoding.
See CSV Import for the full format specification and example files.
---
Download Fails or Returns No Data
Symptoms: Download dialog shows an error, or the chart opens empty after a download attempt.
Steps to fix:
Verify the ticker symbol is correct for the selected provider (format varies: AAPL, AAPL.US, etc.).
Check your internet connection.
Open Setting > Data Provider Setting and confirm the selected provider and API key are correct.
Some providers require an API key. Confirm your API key is active and has not expired.
Try switching providers. Yahoo Finance requires no API key for EOD data; configured Alpaca, Tiingo, or Alpha Vantage accounts can provide supported intraday data.
Check the provider's website for any service outage.
Intraday Period Is Unavailable or Shows No Bars
Symptoms: Selecting 1m, 5m, 30m, or 1h period shows an empty chart or stays on the previous period.
Steps to fix:
Intraday data must be downloaded separately from end-of-day data. Use Download > Download Data, select the intraday provider, and choose an intraday range.
Confirm the selected provider supports intraday data for the symbol. Not all providers offer intraday data for all markets.
Verify that intraday data has been downloaded locally. Use Setting > Default Directory Setting to find the configured parent directory, then look under Data/providers/<provider>/<feed>/<session>/intraday/1min/ for a file matching the ticker. The session folder is us_equities_regular or us_equities_extended, according to Setting > Data Provider Setting.
Some providers only provide a limited number of intraday days. If the saved data is old, re-download it.
---
Indicator Does Not Appear on the Chart
Symptoms: You added an indicator but nothing new appears on the chart.
Steps to fix:
Check whether the indicator is a sub chart indicator — it appears in a separate pane below the price chart, not over the price bars. Scroll down or look for a new pane.
Confirm the chart has enough bars to calculate the indicator. For example, a 200-period SMA requires at least 200 bars of data.
Press F2 to open Indicator Parameters and verify the indicator is listed there and its period is reasonable for the available data length.
Try zooming out to see if the indicator is drawn outside the currently visible range.
---
Crosshair or Hover Box Appears Sluggish
Symptoms: Moving the mouse over the chart with crosshair enabled feels slow or the hover box flickers.
Steps to fix:
Zoom in to reduce the number of visible bars. Rendering a very wide bar range (several thousand bars) requires more work per frame.
Remove any active indicators with very wide calculation windows if you are not using them.
Check if a future release mentions static chart layer caching improvements.
---
Chart Looks Different After Reopening
Symptoms: A saved chart opens with different colors, indicator settings, or chart style than expected.
Steps to fix:
Check whether a default workspace was saved with different settings. Load the chart file directly with File > Open Chart to bypass the workspace.
Verify the .acht file was saved after the last content change. Scrolling, panning, zooming, and changing period do not mark the chart as modified, but indicators, custom indicators, workspace application, display-name edits, chart studies, and chart style changes do.
If the chart style changed, open View > Appearance and confirm the theme is set as expected.
---
App Appears Slow on First Launch
Symptoms: The application takes a long time to start or the first chart loads slowly.
Steps to fix:
The first launch may take longer because macOS verifies the application signature.
Large watchlists trigger background quote requests at startup. Reduce the watchlist size if startup performance is a concern.
---
App Icon Looks Incorrect in the Dock
Symptoms: The macOS Dock shows a generic or incorrect icon for AptiStockX.
Steps to fix:
Confirm you are running the official packaged .app and not a directly launched binary.
Clear the macOS icon cache by running sudo killall Dock in Terminal, or log out and back in.
Drag the app to the Dock again to refresh the icon.
---
Still Having Problems?
If the problem persists, report it with steps to reproduce, your operating system version, and the AptiStockX version number and tier visible in Help > About AptiStockX.