AAPL +1.24% MSFT +0.72% SPY -0.18% QQQ +0.41%
Local-first desktop charting since AptiStock 2005
Home / Features

Features

AptiStockX is a local-first, native desktop charting workstation for Windows, macOS, and Linux.

Local dataWindows / macOS / LinuxAI Assistant
Core features

Six product strengths, shown in detail.

Each feature is designed around the same philosophy: local control, desktop speed, and practical charting depth without cloud workspace lock-in.

Local data

Transparent CSV data and local JSON workspaces.

Like the original AptiStock, AptiStockX keeps market data transparent. EOD and intraday data can live as CSV files on the user's local drive, while chart templates, workspace configuration, and application settings are saved locally in clear JSON files.

  • No cloud account is required to open, inspect, copy, back up, or move your charting data.
  • CSV market data keeps the data layer understandable instead of hiding it inside a proprietary cloud database.
  • JSON templates and settings make workspace state transparent and recoverable.
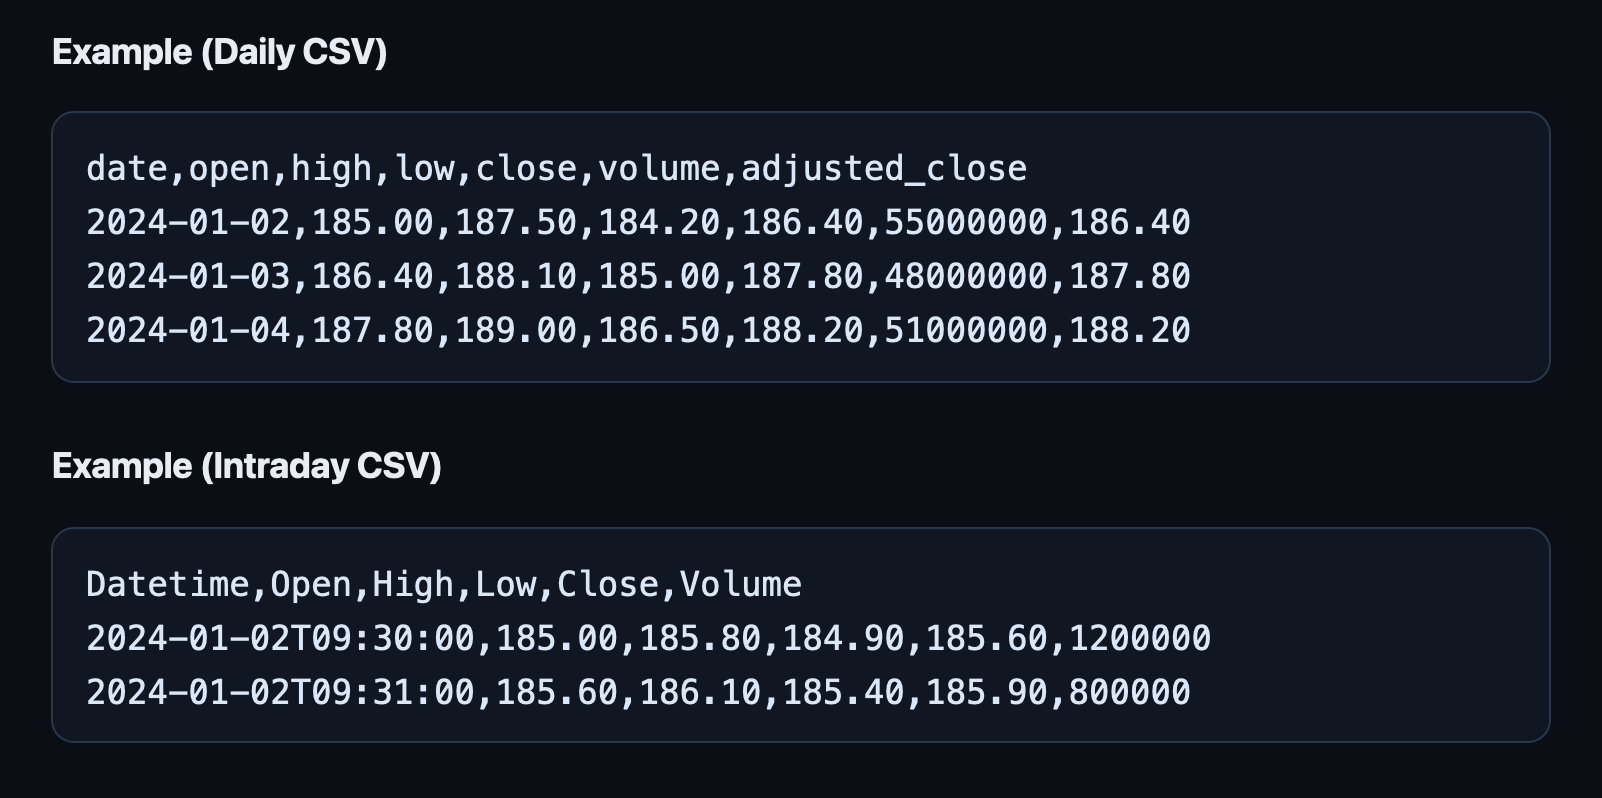
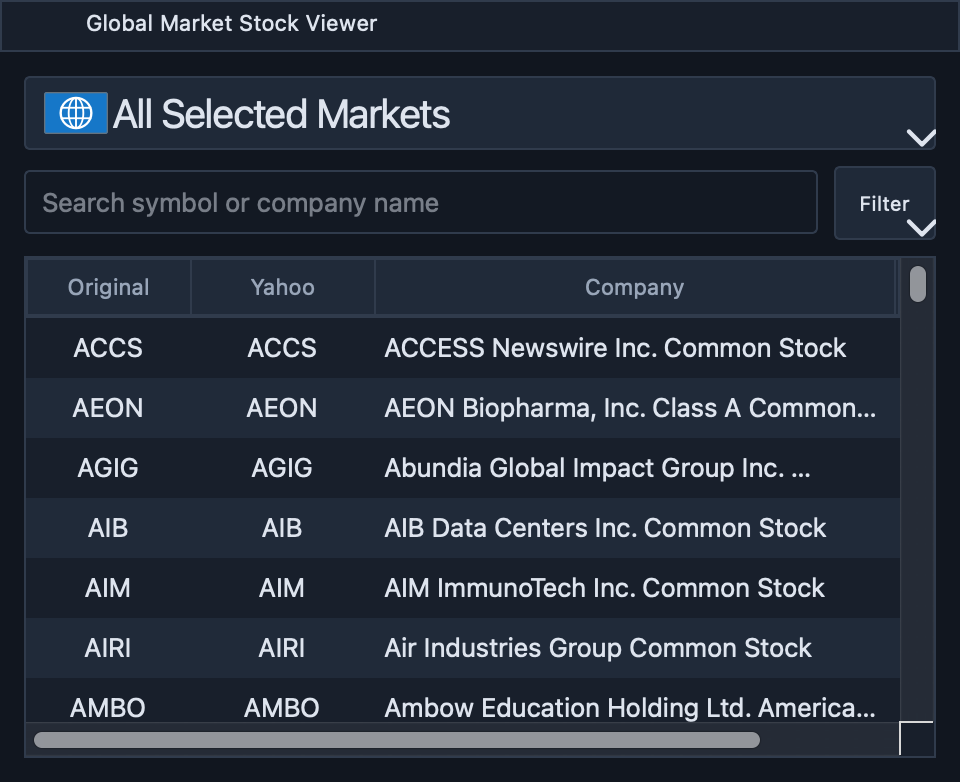
AptiStockX local CSV stock data folder and files
Cross-platform

Windows, macOS, and Linux from the same desktop product line.

AptiStockX is designed as a native desktop application across the three workstation platforms serious users actually run: Windows, macOS, and Linux.

  • Direct downloads are presented for all three systems.
  • The same local data philosophy applies on each operating system.
  • One product identity, one local-first workflow, three desktop environments.
Windows macOS Linux

Choose the installer for your operating system, then keep your chart files and data under your own local folder structure.

Native desktop performance

Two 40-year charts are an easy workload, not the limit.

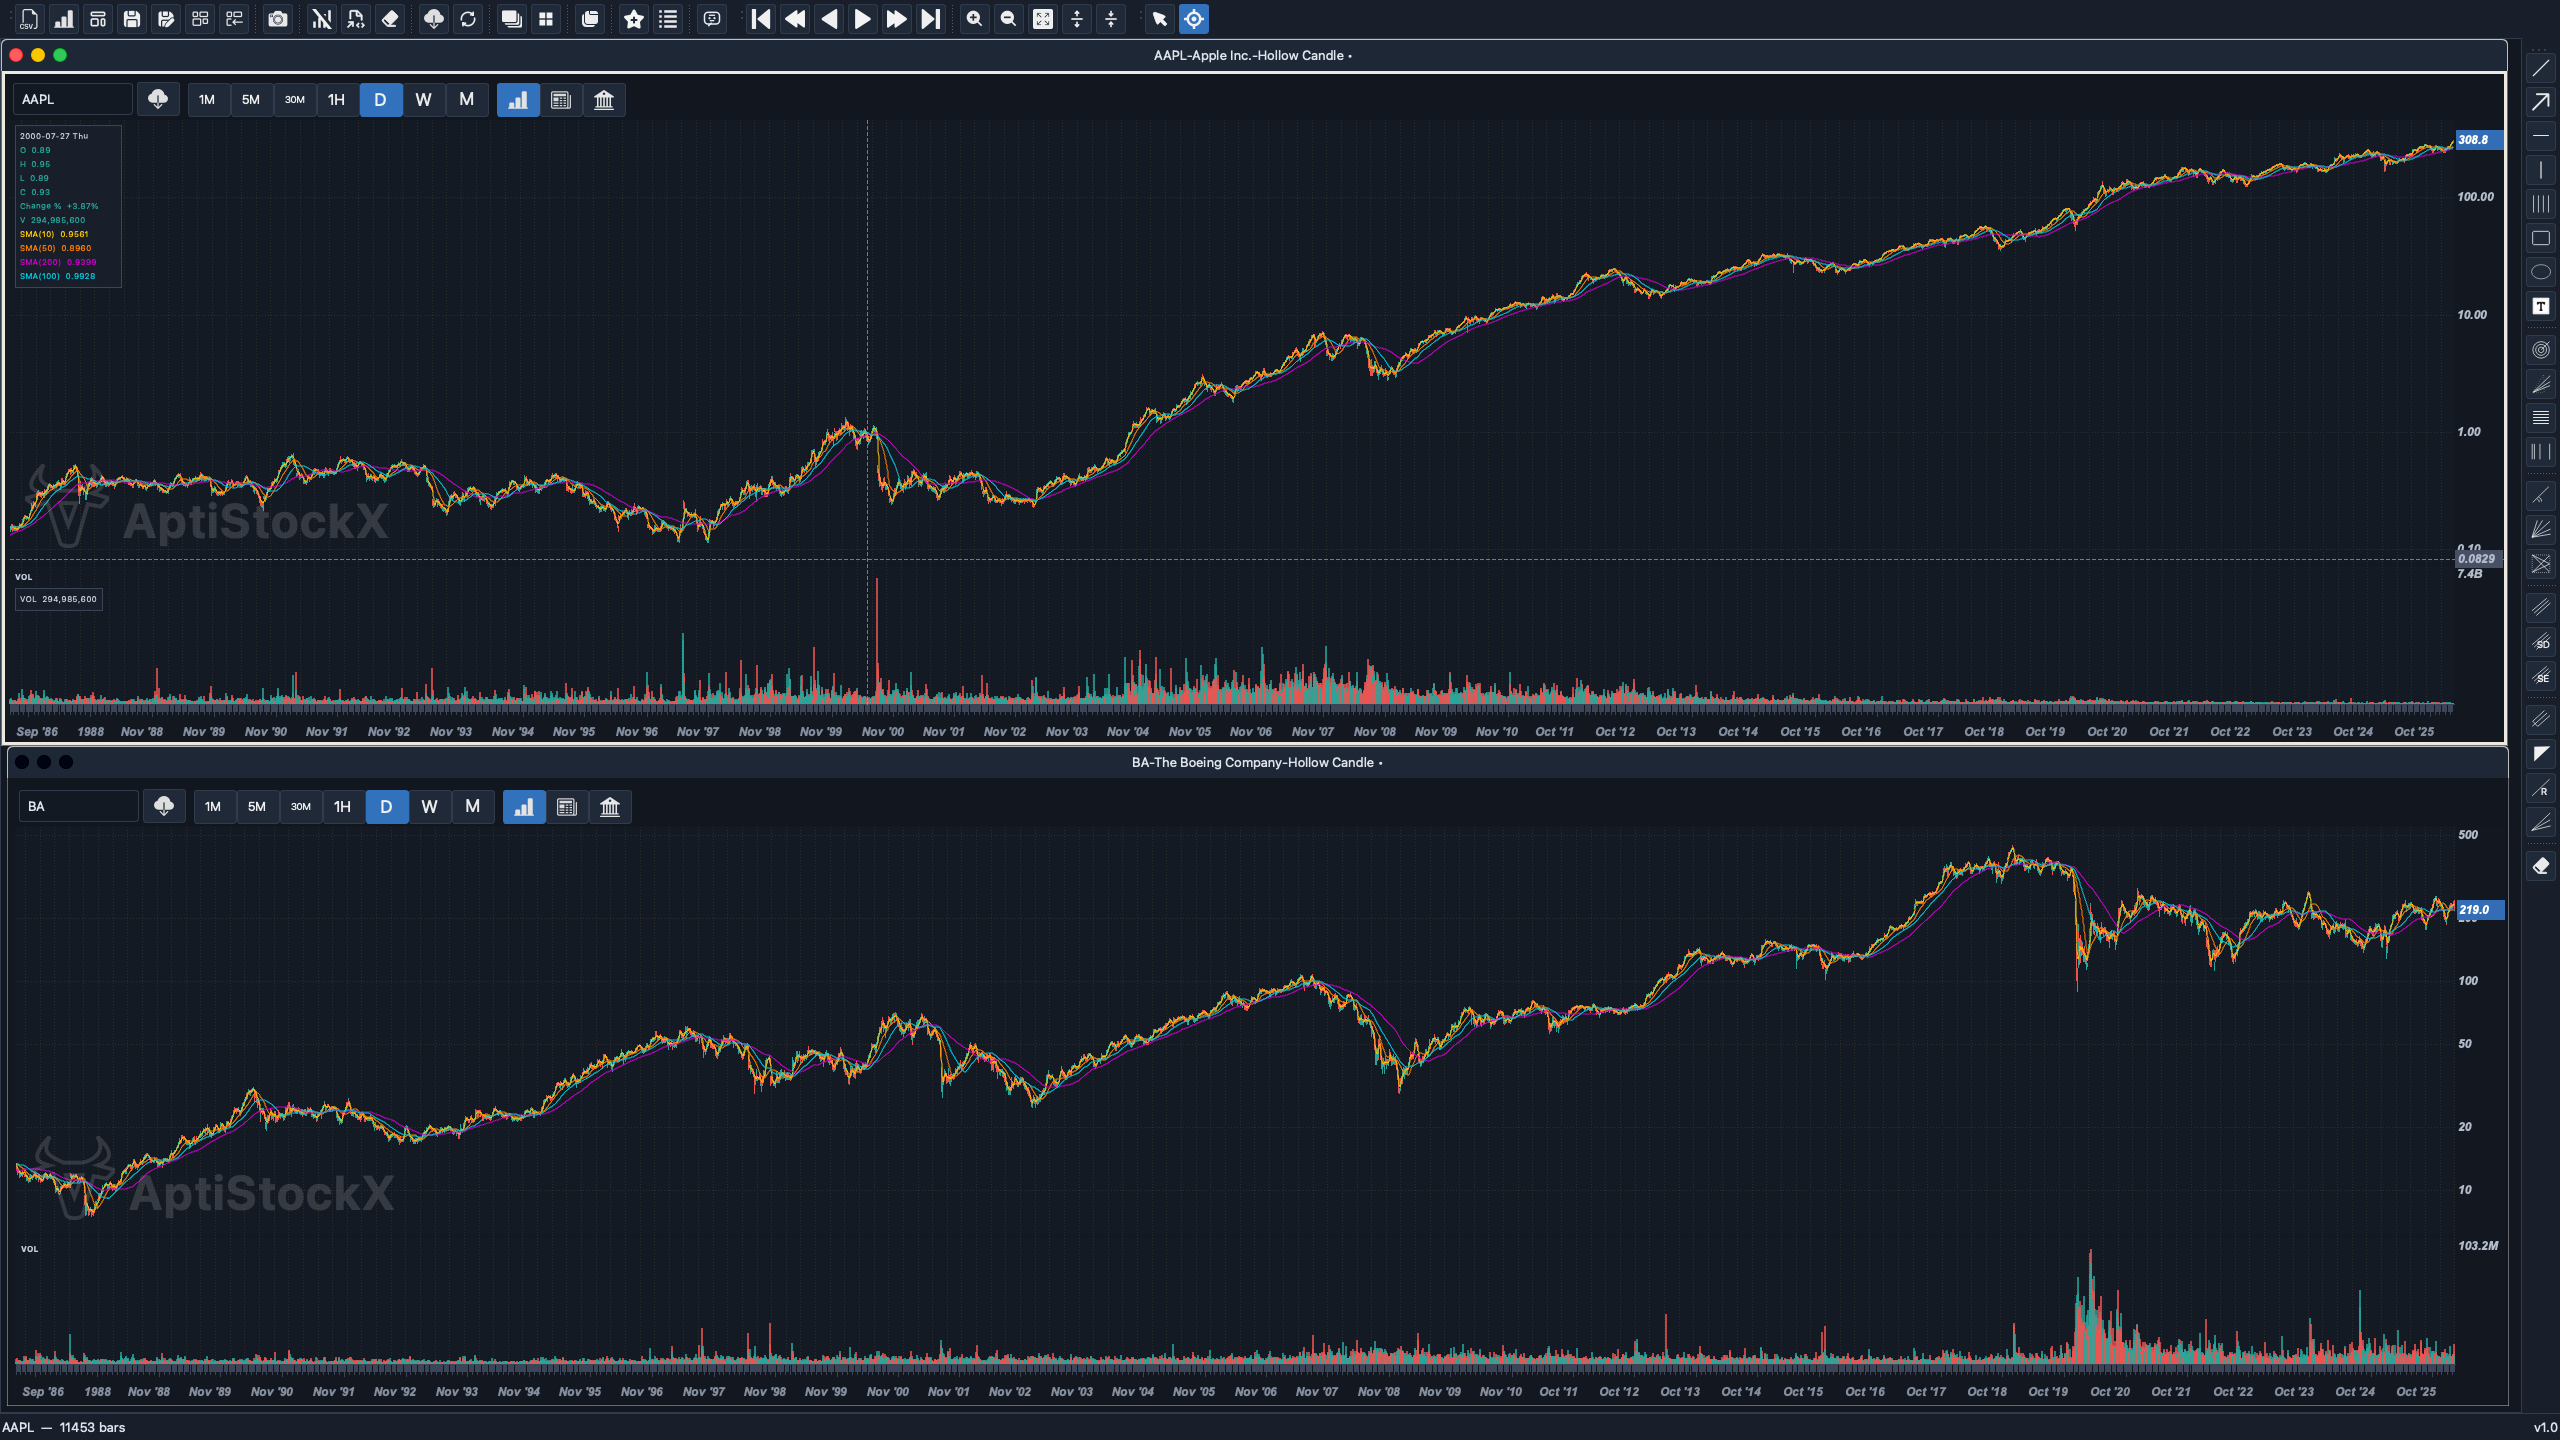
AptiStockX is a platform-native Qt/C++ application designed for long chart histories. The screenshot shows two stocks with roughly 40 years of data loaded together; users can load more symbols and longer periods as their laptop RAM, CPU, and dataset size allow.

  • Built for workstation-style research with large historical datasets.
  • Two long-history charts are a baseline example, not a special maximum.
  • Scale up to more symbols, more windows, and longer histories when your hardware has headroom.
AptiStockX workspace showing two stocks with roughly 40 years of chart data
Customizable workflow

Scriptable indicators and line studies for personal charting style.

AptiStockX supports a customizable charting flow: custom indicator scripts, indicator settings, drawing studies, and line-study tools that let users build a repeatable visual research process.

  • Custom indicator editor for transparent script-based studies.
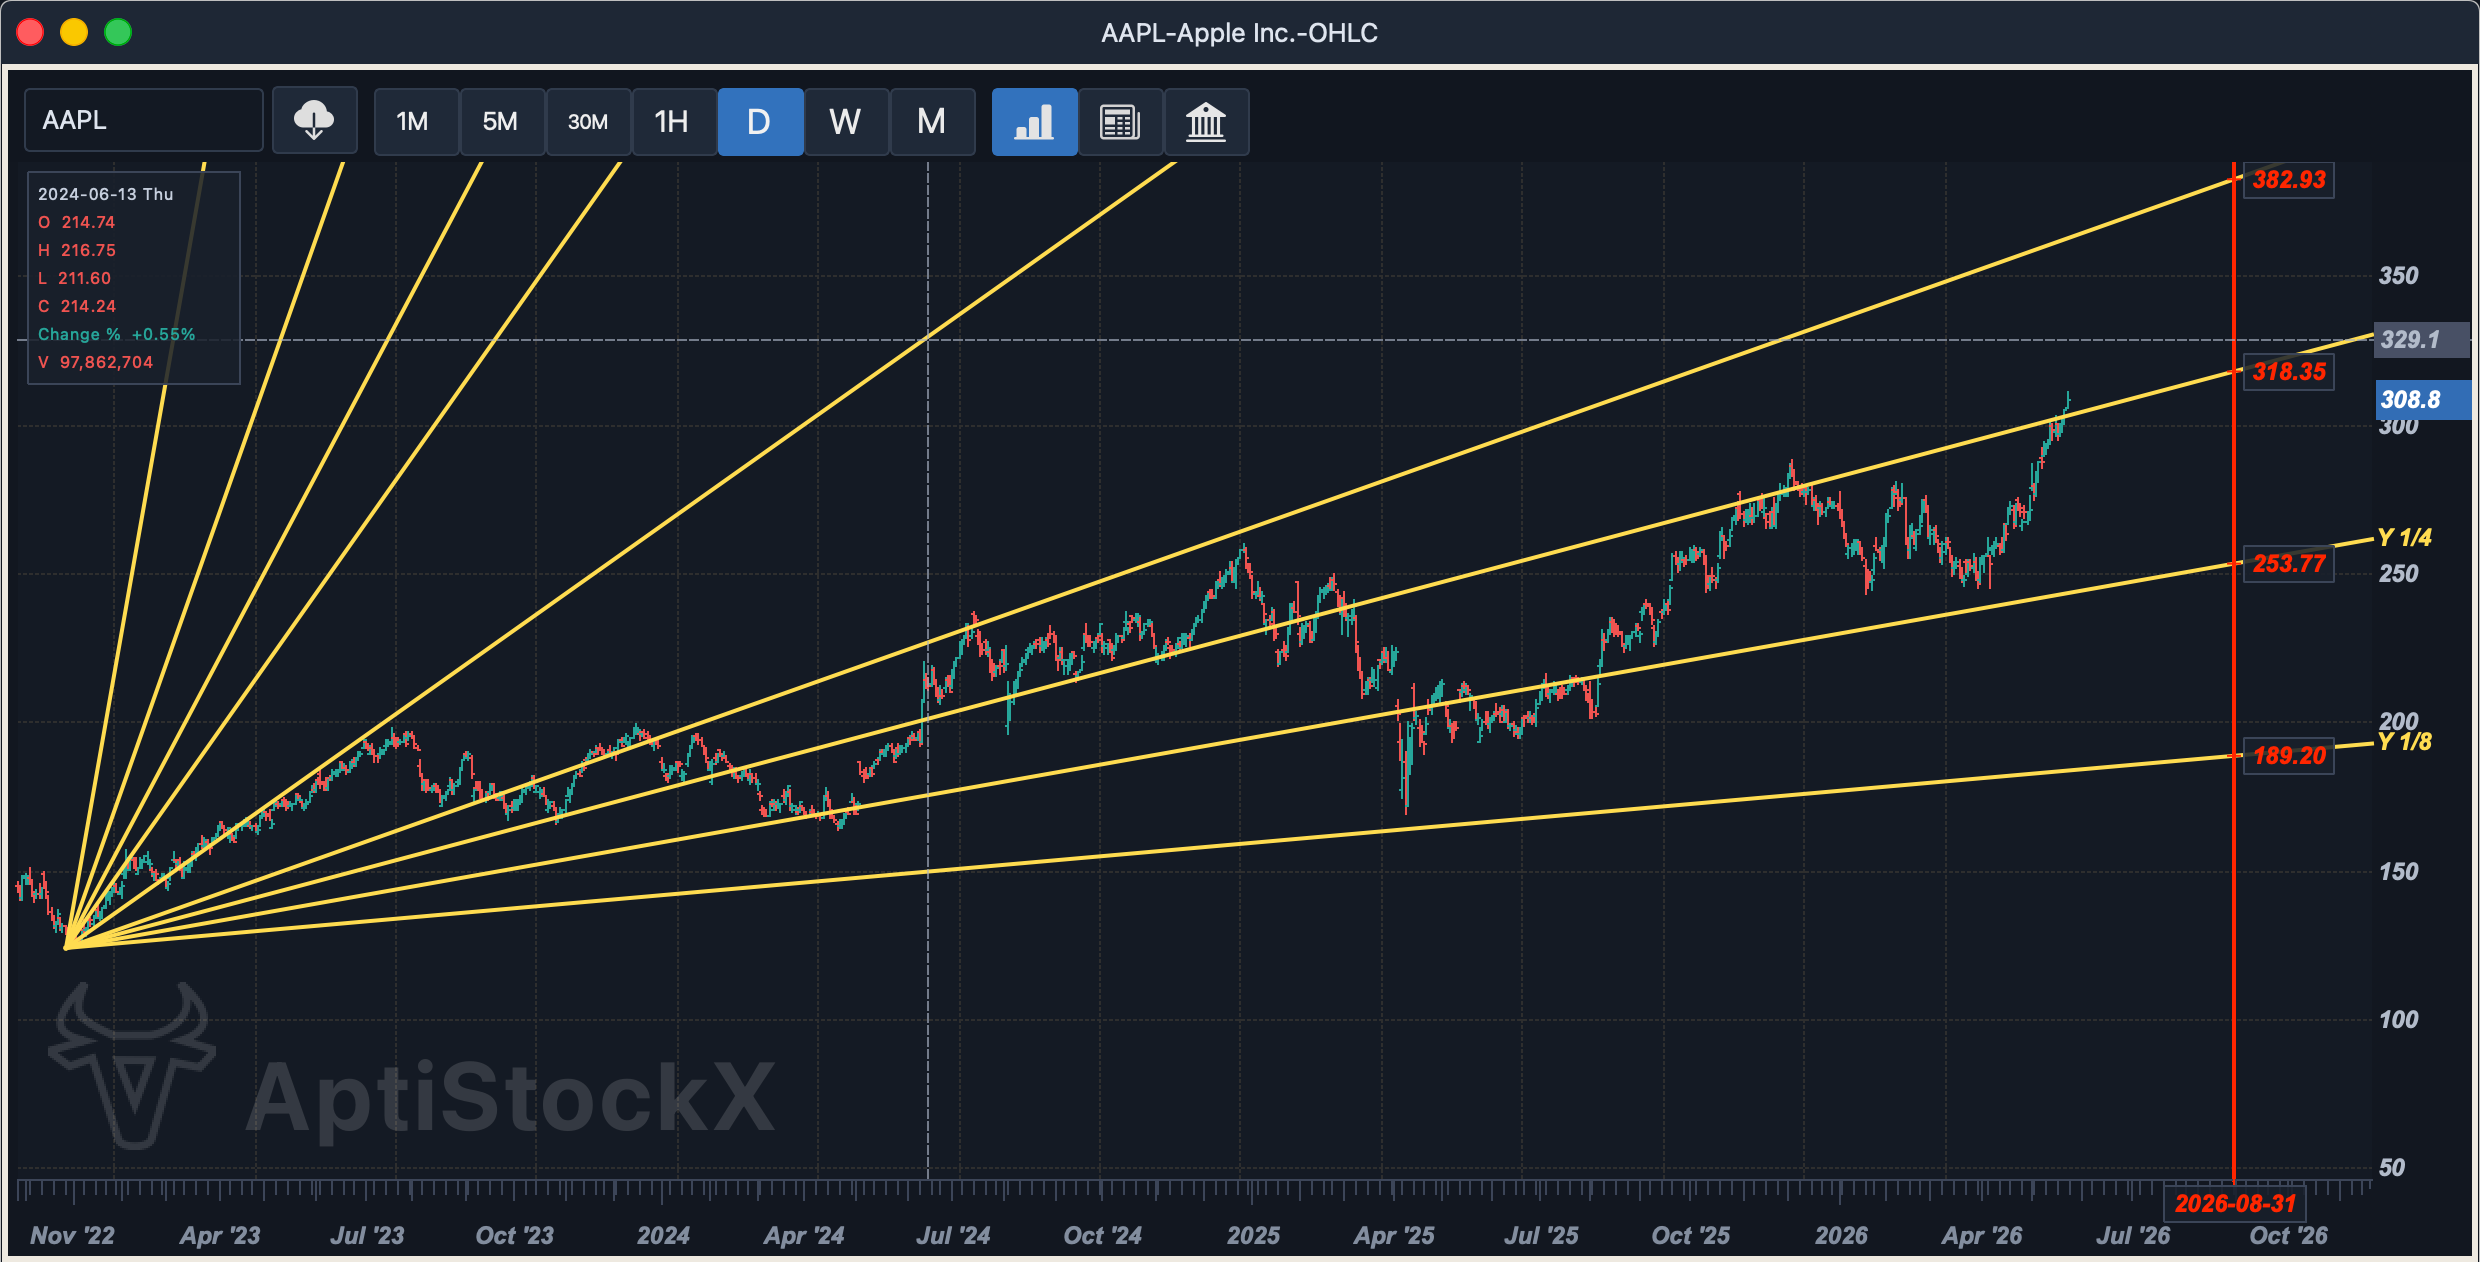
  • Line studies and drawing tools support trend lines, channels, Fibonacci/Gann workflows, shapes, and text.
  • Workspaces and templates preserve the user's preferred chart setup.
AptiStockX line study tools on a chart
Multiple monitor support

Detach charts and spread the workspace across a real desk.

AptiStockX is built for users who work with more than one screen. Keep the main workspace on one monitor and move detached chart windows to another monitor for broader market context.

  • Main workspace can stay focused on symbols, data, and toolbars.
  • Detached windows make it easier to watch separate symbols, timeframes, or studies.
  • Multi-monitor layouts support the way serious chart users actually work.
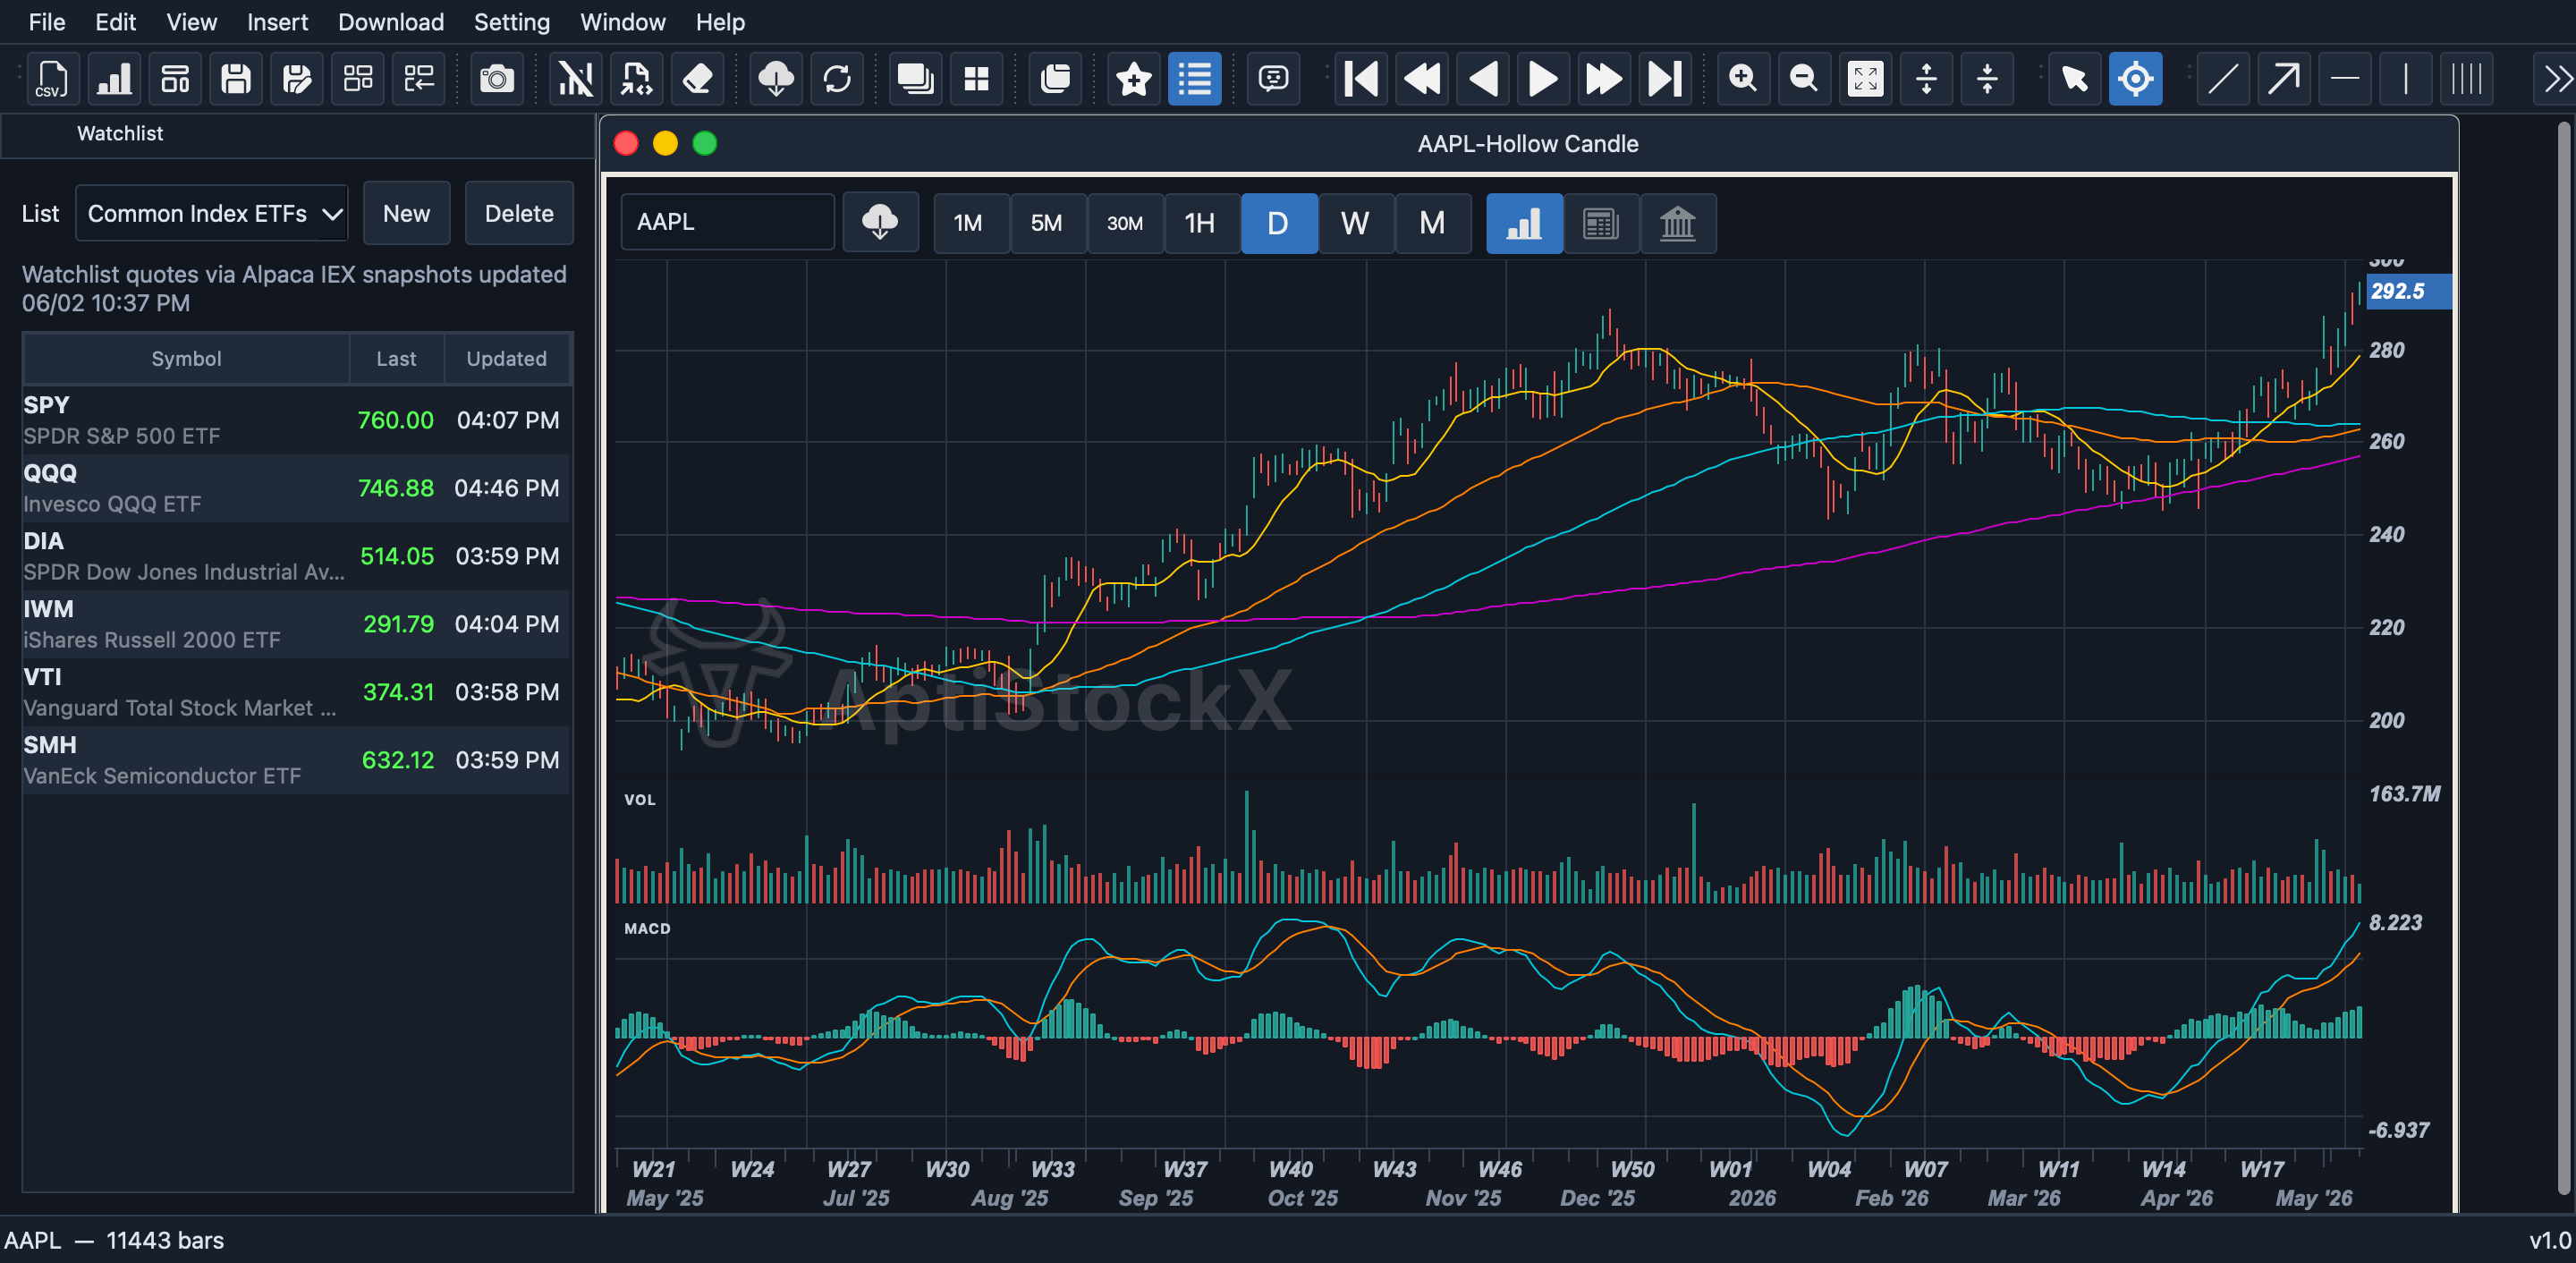
Monitor 1: Main workspace
AptiStockX main workspace
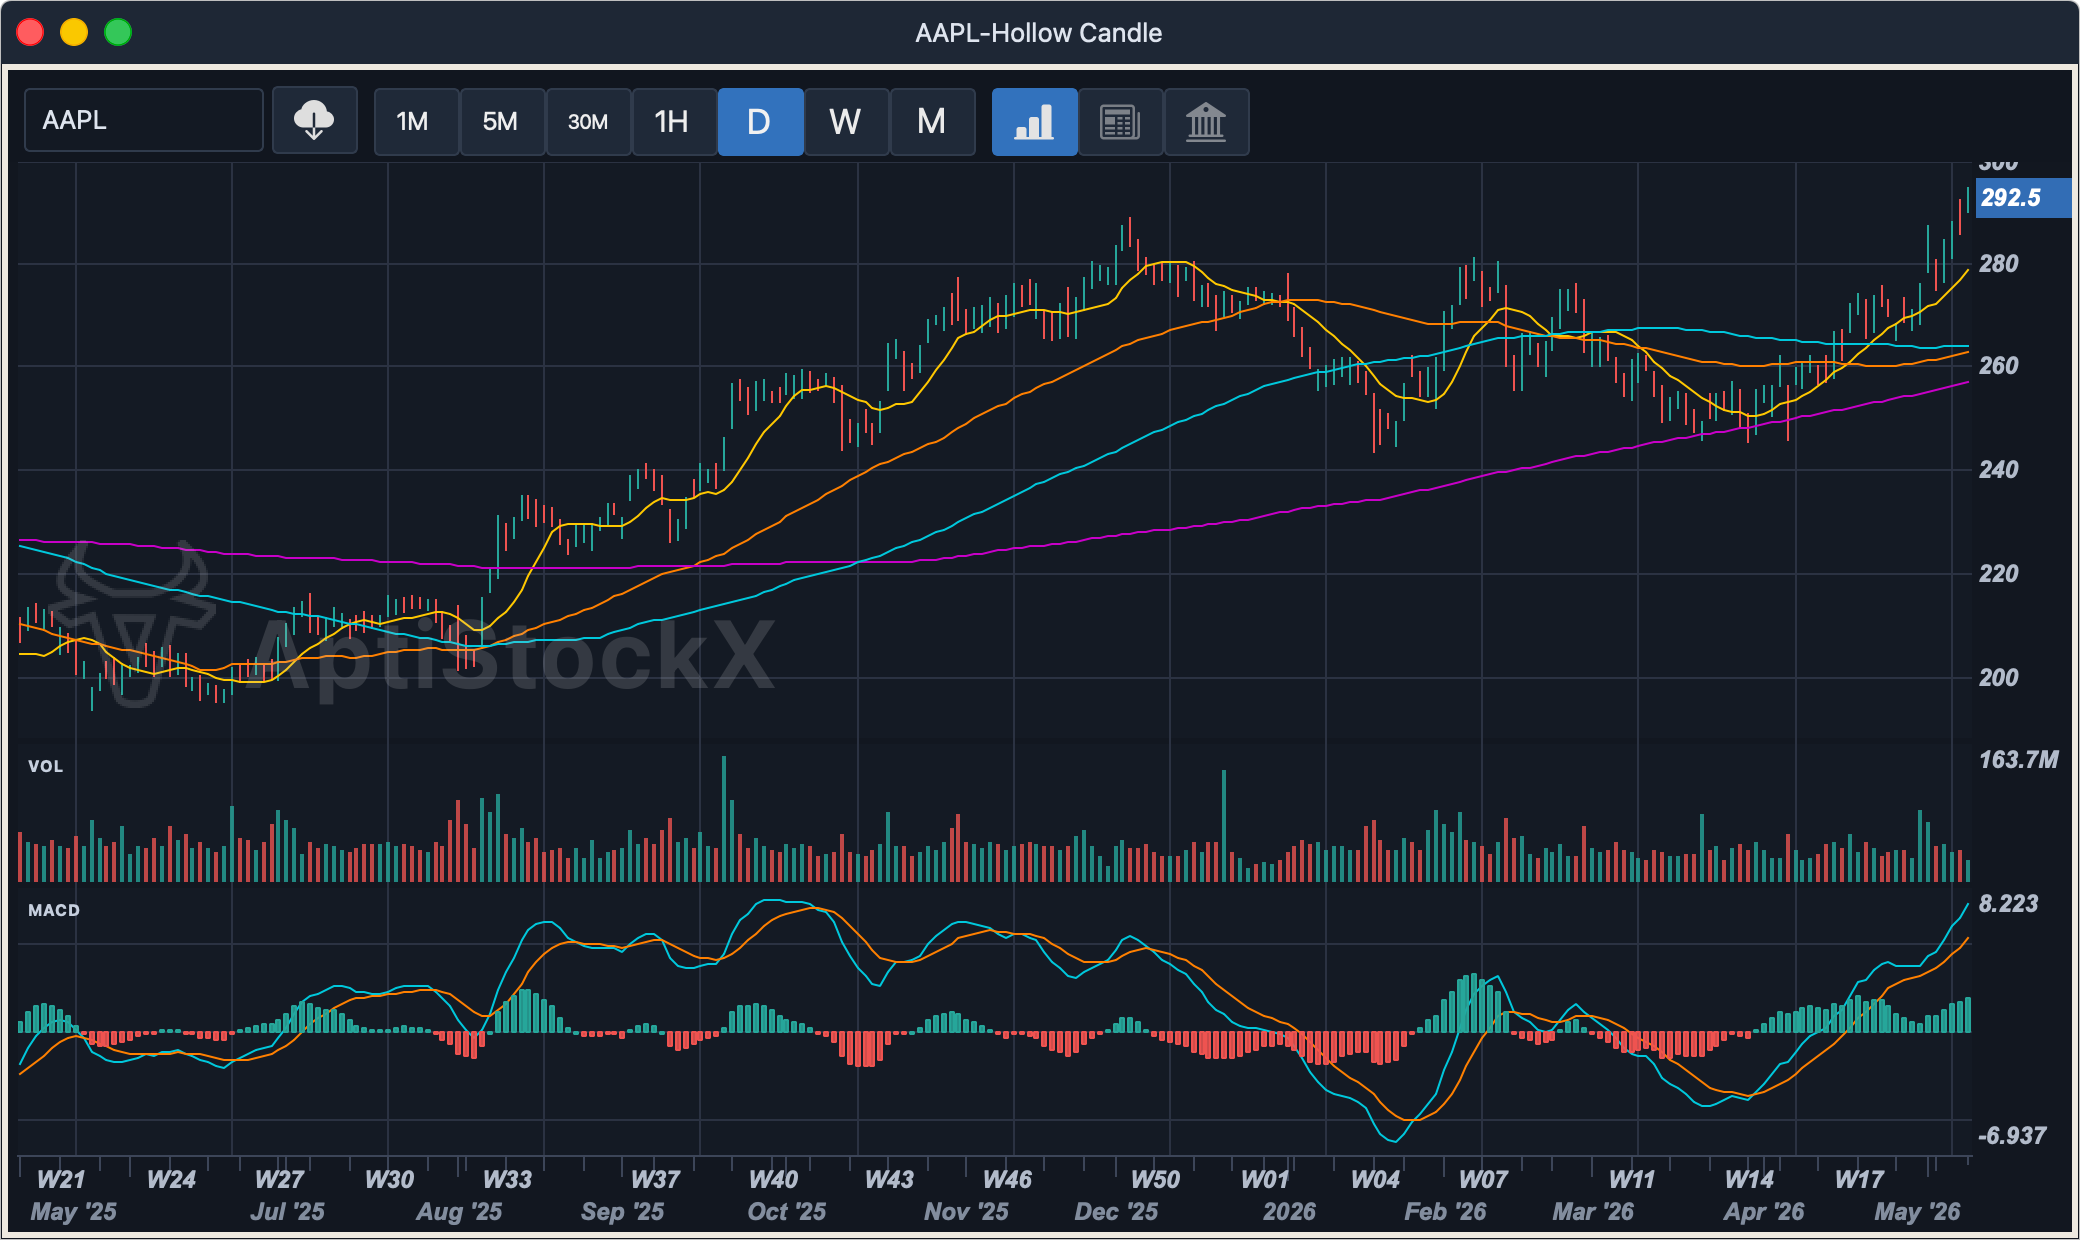
Monitor 2: Detached chart
AptiStockX detached chart window
AI Assistant

Educational chart review from the AptiStockX workspace.

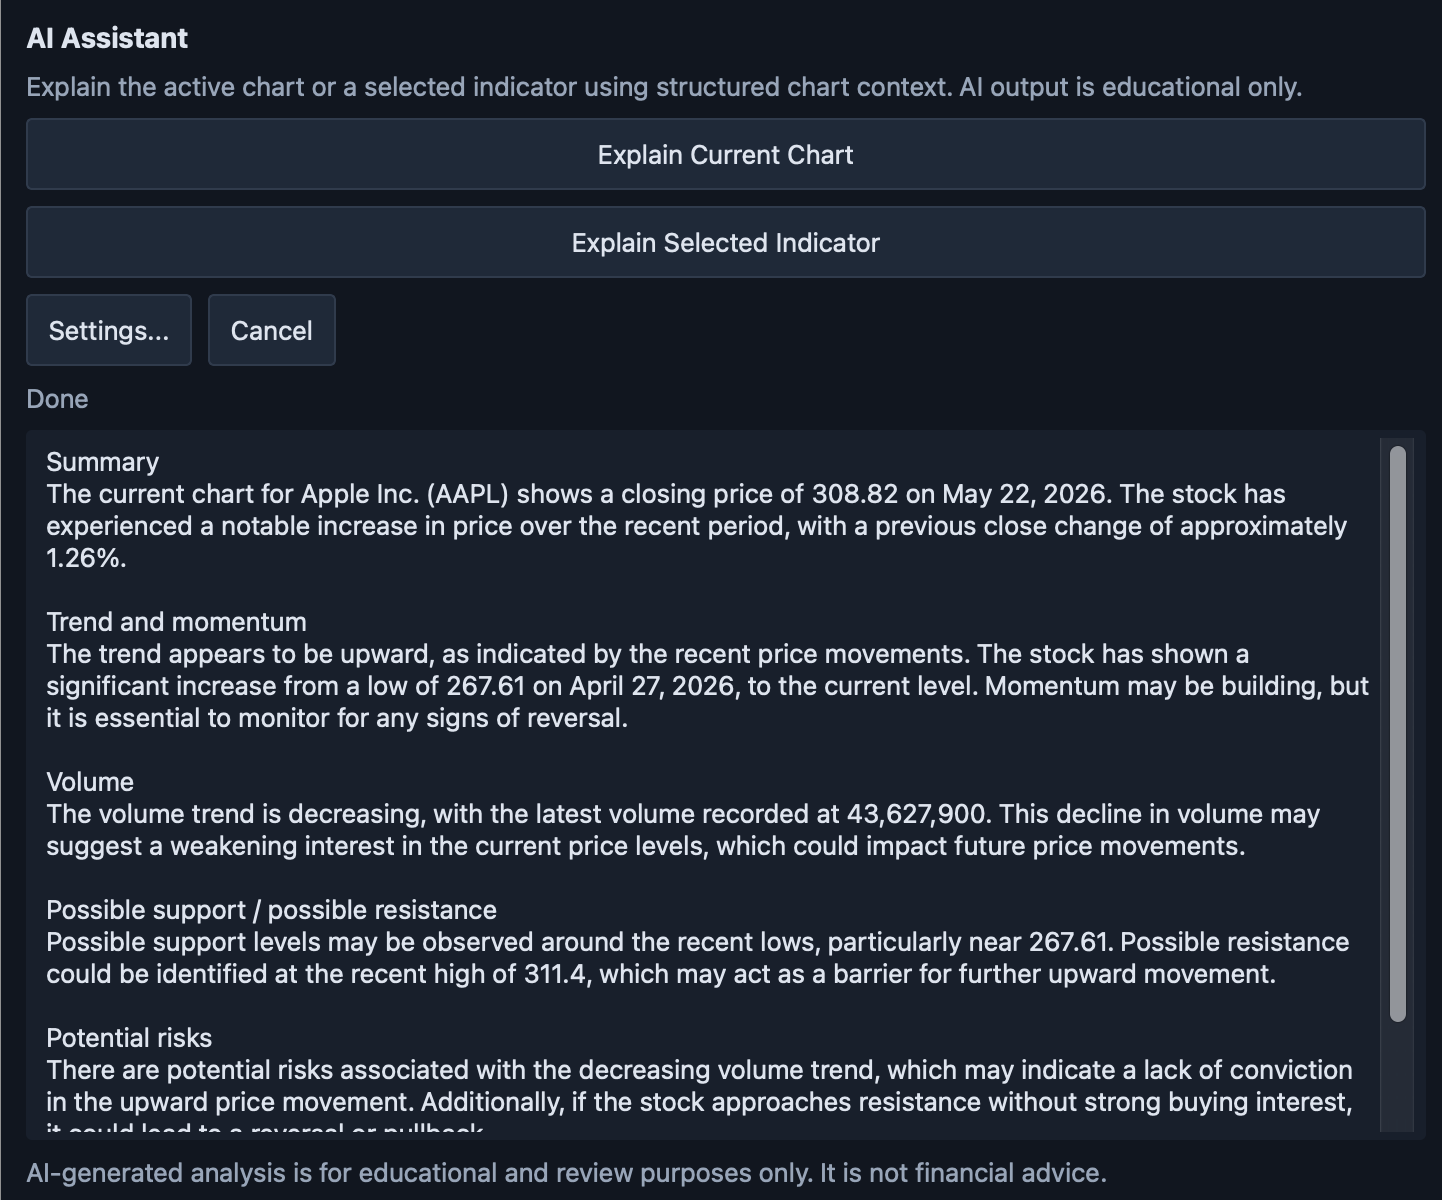
The AI Assistant can explain visible chart context and selected indicators in plain language. It is designed for education and research support, not financial advice or buy/sell signals.

  • Review the current chart using structured visible chart context.
  • Explain selected indicators without leaving the desktop workspace.
  • Supports OpenAI-compatible cloud or local providers when configured by the user.
AptiStockX AI Assistant panel explaining visible chart context
Basic vs Pro

Basic keeps the AptiStock core. Pro is for professional charting depth.

Basic covers the everyday charting capability returning AptiStock users expect. Pro adds the deeper workflows: intraday periods, advanced chart styles, richer studies, multiple workspaces, multi-monitor work, and AI chart review.

Basic

Core charting continuity

Basic is the free AptiStockX tier for local charting fundamentals. The goal is simple: the basic charting capability users got from classic AptiStock should still feel available in AptiStockX.

  • Local CSV data for transparent daily, weekly, and monthly charting
  • Core candlestick, OHLC bar, and line charts
  • Standard indicators such as MA, EMA, and MACD
  • Basic line and arrow studies for everyday annotation
  • Single workspace/layout with local templates and settings
Pro

Professional charting workflows

Pro is for users who need more market depth, more screen space, more customization, and faster review loops.

Intraday periods

Use intraday chart periods and larger active datasets for deeper session review.

Advanced chart styles

Work with Heikin-Ashi, Renko, Range, and other advanced chart views where available.

Indicators

Broader indicator workflows, richer configuration, advanced indicators, and custom indicator direction.

Line studies

Expanded drawing studies including Fibonacci, Gann, channels, shapes, text, and more detailed technical annotation.

Workspace depth

Multiple chart windows, panes, saved layouts, detached windows, and multi-monitor workflows.

AI Assistant

Educational chart explanation and selected-indicator explanation using visible chart context.